Immigrants from the Azores vs Immigrants from Yemen Disability Age 65 to 74
COMPARE
Immigrants from the Azores
Immigrants from Yemen
Disability Age 65 to 74
Disability Age 65 to 74 Comparison
Immigrants from the Azores
Immigrants from Yemen
26.0%
DISABILITY AGE 65 TO 74
0.0/ 100
METRIC RATING
284th/ 347
METRIC RANK
27.0%
DISABILITY AGE 65 TO 74
0.0/ 100
METRIC RATING
298th/ 347
METRIC RANK
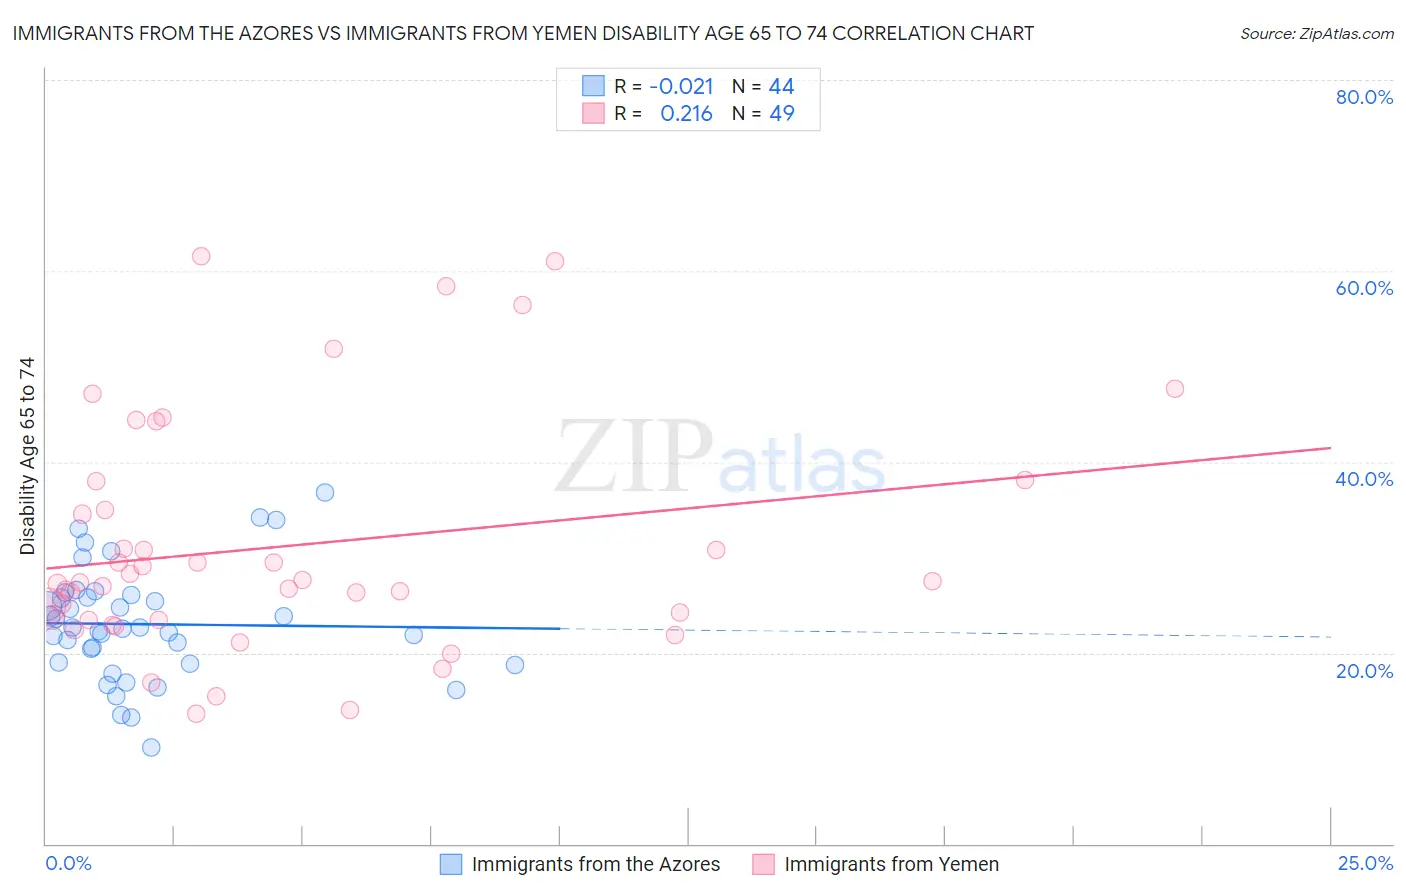
Immigrants from the Azores vs Immigrants from Yemen Disability Age 65 to 74 Correlation Chart
The statistical analysis conducted on geographies consisting of 46,238,096 people shows no correlation between the proportion of Immigrants from the Azores and percentage of population with a disability between the ages 65 and 75 in the United States with a correlation coefficient (R) of -0.021 and weighted average of 26.0%. Similarly, the statistical analysis conducted on geographies consisting of 82,411,382 people shows a weak positive correlation between the proportion of Immigrants from Yemen and percentage of population with a disability between the ages 65 and 75 in the United States with a correlation coefficient (R) of 0.216 and weighted average of 27.0%, a difference of 3.9%.
Disability Age 65 to 74 Correlation Summary
| Measurement | Immigrants from the Azores | Immigrants from Yemen |
| Minimum | 10.1% | 13.6% |
| Maximum | 36.7% | 61.5% |
| Range | 26.6% | 48.0% |
| Mean | 23.0% | 31.1% |
| Median | 22.6% | 27.4% |
| Interquartile 25% (IQ1) | 18.9% | 23.5% |
| Interquartile 75% (IQ3) | 25.9% | 36.4% |
| Interquartile Range (IQR) | 7.1% | 13.0% |
| Standard Deviation (Sample) | 5.8% | 12.1% |
| Standard Deviation (Population) | 5.8% | 12.0% |
Demographics Similar to Immigrants from the Azores and Immigrants from Yemen by Disability Age 65 to 74
In terms of disability age 65 to 74, the demographic groups most similar to Immigrants from the Azores are Immigrants from Congo (26.0%, a difference of 0.020%), Spanish American (25.9%, a difference of 0.19%), Delaware (25.9%, a difference of 0.33%), Immigrants from Honduras (25.9%, a difference of 0.40%), and Immigrants from Micronesia (26.1%, a difference of 0.44%). Similarly, the demographic groups most similar to Immigrants from Yemen are Fijian (27.0%, a difference of 0.020%), Potawatomi (27.0%, a difference of 0.030%), Immigrants from Dominican Republic (27.0%, a difference of 0.060%), Immigrants from Mexico (27.1%, a difference of 0.38%), and Bangladeshi (26.8%, a difference of 0.61%).
| Demographics | Rating | Rank | Disability Age 65 to 74 |
| Immigrants | Honduras | 0.1 /100 | #281 | Tragic 25.9% |
| Delaware | 0.1 /100 | #282 | Tragic 25.9% |
| Spanish Americans | 0.0 /100 | #283 | Tragic 25.9% |
| Immigrants | Azores | 0.0 /100 | #284 | Tragic 26.0% |
| Immigrants | Congo | 0.0 /100 | #285 | Tragic 26.0% |
| Immigrants | Micronesia | 0.0 /100 | #286 | Tragic 26.1% |
| Immigrants | Laos | 0.0 /100 | #287 | Tragic 26.1% |
| Mexican American Indians | 0.0 /100 | #288 | Tragic 26.2% |
| Africans | 0.0 /100 | #289 | Tragic 26.2% |
| Immigrants | Cabo Verde | 0.0 /100 | #290 | Tragic 26.3% |
| Spanish American Indians | 0.0 /100 | #291 | Tragic 26.4% |
| Blackfeet | 0.0 /100 | #292 | Tragic 26.6% |
| Immigrants | Central America | 0.0 /100 | #293 | Tragic 26.6% |
| Dominicans | 0.0 /100 | #294 | Tragic 26.7% |
| Hispanics or Latinos | 0.0 /100 | #295 | Tragic 26.7% |
| Bangladeshis | 0.0 /100 | #296 | Tragic 26.8% |
| Fijians | 0.0 /100 | #297 | Tragic 27.0% |
| Immigrants | Yemen | 0.0 /100 | #298 | Tragic 27.0% |
| Potawatomi | 0.0 /100 | #299 | Tragic 27.0% |
| Immigrants | Dominican Republic | 0.0 /100 | #300 | Tragic 27.0% |
| Immigrants | Mexico | 0.0 /100 | #301 | Tragic 27.1% |