West Indian vs Lumbee Disability Age Over 75
COMPARE
West Indian
Lumbee
Disability Age Over 75
Disability Age Over 75 Comparison
West Indians
Lumbee
48.6%
DISABILITY AGE OVER 75
0.8/ 100
METRIC RATING
250th/ 347
METRIC RANK
56.2%
DISABILITY AGE OVER 75
0.0/ 100
METRIC RATING
342nd/ 347
METRIC RANK
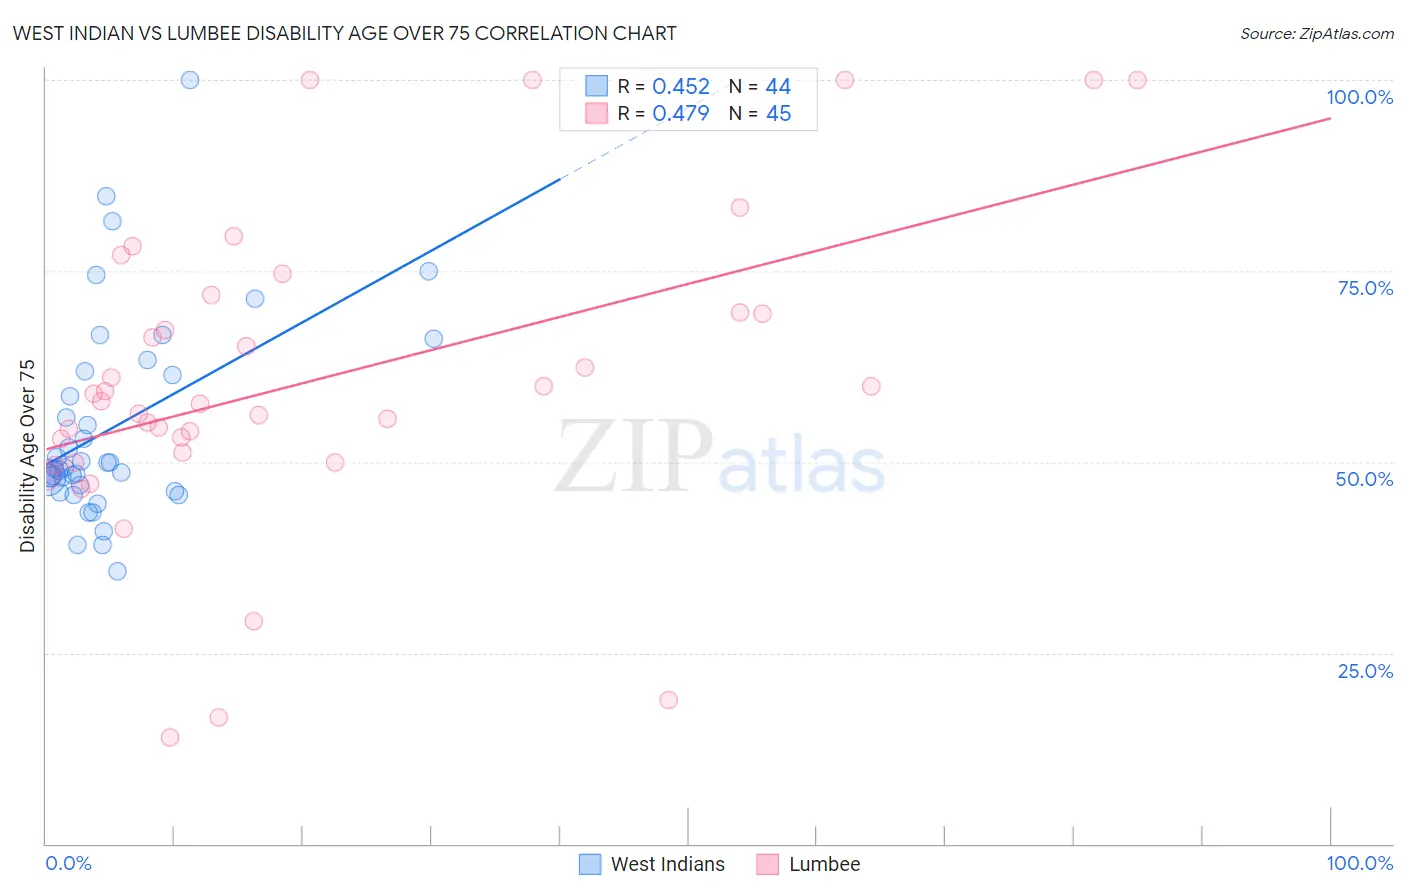
West Indian vs Lumbee Disability Age Over 75 Correlation Chart
The statistical analysis conducted on geographies consisting of 253,625,945 people shows a moderate positive correlation between the proportion of West Indians and percentage of population with a disability over the age of 75 in the United States with a correlation coefficient (R) of 0.452 and weighted average of 48.6%. Similarly, the statistical analysis conducted on geographies consisting of 92,131,949 people shows a moderate positive correlation between the proportion of Lumbee and percentage of population with a disability over the age of 75 in the United States with a correlation coefficient (R) of 0.479 and weighted average of 56.2%, a difference of 15.7%.
Disability Age Over 75 Correlation Summary
| Measurement | West Indian | Lumbee |
| Minimum | 35.7% | 13.8% |
| Maximum | 100.0% | 100.0% |
| Range | 64.3% | 86.2% |
| Mean | 54.5% | 60.7% |
| Median | 49.1% | 58.0% |
| Interquartile 25% (IQ1) | 46.6% | 50.6% |
| Interquartile 75% (IQ3) | 61.6% | 70.7% |
| Interquartile Range (IQR) | 15.0% | 20.1% |
| Standard Deviation (Sample) | 13.3% | 20.4% |
| Standard Deviation (Population) | 13.2% | 20.2% |
Similar Demographics by Disability Age Over 75
Demographics Similar to West Indians by Disability Age Over 75
In terms of disability age over 75, the demographic groups most similar to West Indians are Korean (48.6%, a difference of 0.020%), Iraqi (48.6%, a difference of 0.080%), Immigrants from South Eastern Asia (48.7%, a difference of 0.12%), British West Indian (48.7%, a difference of 0.16%), and Immigrants from Vietnam (48.7%, a difference of 0.20%).
| Demographics | Rating | Rank | Disability Age Over 75 |
| Immigrants | Caribbean | 2.1 /100 | #243 | Tragic 48.4% |
| Afghans | 1.8 /100 | #244 | Tragic 48.4% |
| Americans | 1.7 /100 | #245 | Tragic 48.4% |
| Chippewa | 1.6 /100 | #246 | Tragic 48.4% |
| Iroquois | 1.6 /100 | #247 | Tragic 48.4% |
| Sri Lankans | 1.4 /100 | #248 | Tragic 48.5% |
| Iraqis | 1.0 /100 | #249 | Tragic 48.6% |
| West Indians | 0.8 /100 | #250 | Tragic 48.6% |
| Koreans | 0.8 /100 | #251 | Tragic 48.6% |
| Immigrants | South Eastern Asia | 0.7 /100 | #252 | Tragic 48.7% |
| British West Indians | 0.6 /100 | #253 | Tragic 48.7% |
| Immigrants | Vietnam | 0.6 /100 | #254 | Tragic 48.7% |
| Chinese | 0.5 /100 | #255 | Tragic 48.7% |
| Immigrants | Congo | 0.5 /100 | #256 | Tragic 48.7% |
| Blackfeet | 0.5 /100 | #257 | Tragic 48.8% |
Demographics Similar to Lumbee by Disability Age Over 75
In terms of disability age over 75, the demographic groups most similar to Lumbee are Houma (56.2%, a difference of 0.16%), Pueblo (55.9%, a difference of 0.67%), Pima (55.8%, a difference of 0.76%), Tohono O'odham (56.7%, a difference of 0.83%), and Colville (55.4%, a difference of 1.6%).
| Demographics | Rating | Rank | Disability Age Over 75 |
| Apache | 0.0 /100 | #333 | Tragic 53.6% |
| Alaskan Athabascans | 0.0 /100 | #334 | Tragic 54.0% |
| Kiowa | 0.0 /100 | #335 | Tragic 54.2% |
| Immigrants | Armenia | 0.0 /100 | #336 | Tragic 54.3% |
| Yuman | 0.0 /100 | #337 | Tragic 54.4% |
| Colville | 0.0 /100 | #338 | Tragic 55.4% |
| Pima | 0.0 /100 | #339 | Tragic 55.8% |
| Pueblo | 0.0 /100 | #340 | Tragic 55.9% |
| Houma | 0.0 /100 | #341 | Tragic 56.2% |
| Lumbee | 0.0 /100 | #342 | Tragic 56.2% |
| Tohono O'odham | 0.0 /100 | #343 | Tragic 56.7% |
| Navajo | 0.0 /100 | #344 | Tragic 58.3% |
| Inupiat | 0.0 /100 | #345 | Tragic 58.4% |
| Tsimshian | 0.0 /100 | #346 | Tragic 59.2% |
| Yup'ik | 0.0 /100 | #347 | Tragic 61.1% |