Albanian vs West Indian Disability Age 18 to 34
COMPARE
Albanian
West Indian
Disability Age 18 to 34
Disability Age 18 to 34 Comparison
Albanians
West Indians
6.4%
DISABILITY AGE 18 TO 34
85.3/ 100
METRIC RATING
144th/ 347
METRIC RANK
6.3%
DISABILITY AGE 18 TO 34
92.0/ 100
METRIC RATING
127th/ 347
METRIC RANK
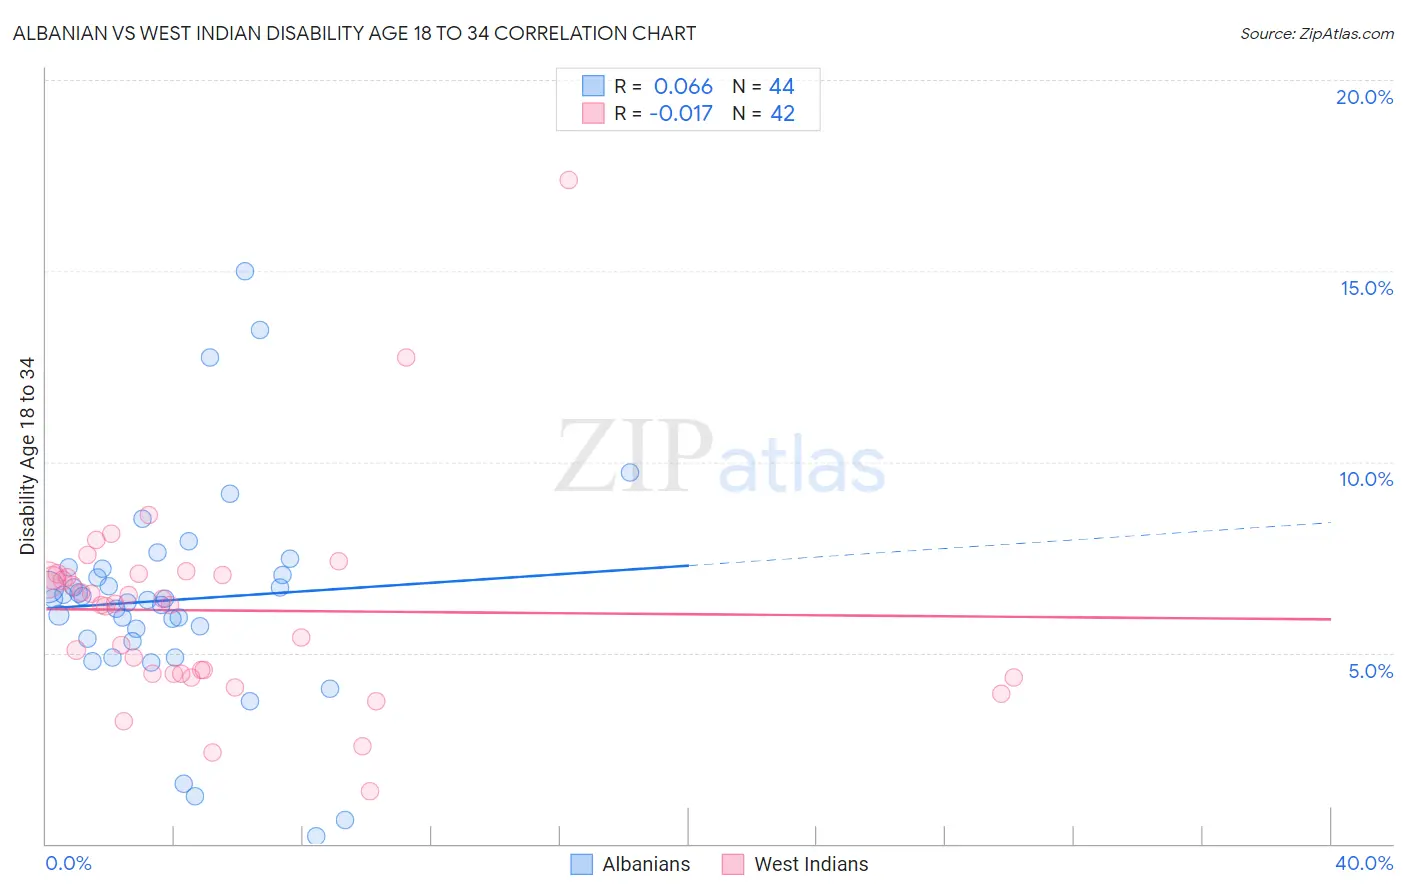
Albanian vs West Indian Disability Age 18 to 34 Correlation Chart
The statistical analysis conducted on geographies consisting of 192,986,276 people shows a slight positive correlation between the proportion of Albanians and percentage of population with a disability between the ages 18 and 35 in the United States with a correlation coefficient (R) of 0.066 and weighted average of 6.4%. Similarly, the statistical analysis conducted on geographies consisting of 253,877,973 people shows no correlation between the proportion of West Indians and percentage of population with a disability between the ages 18 and 35 in the United States with a correlation coefficient (R) of -0.017 and weighted average of 6.3%, a difference of 1.2%.
Disability Age 18 to 34 Correlation Summary
| Measurement | Albanian | West Indian |
| Minimum | 0.20% | 1.4% |
| Maximum | 15.0% | 17.4% |
| Range | 14.8% | 16.0% |
| Mean | 6.4% | 6.1% |
| Median | 6.4% | 6.3% |
| Interquartile 25% (IQ1) | 5.3% | 4.4% |
| Interquartile 75% (IQ3) | 7.1% | 7.0% |
| Interquartile Range (IQR) | 1.8% | 2.6% |
| Standard Deviation (Sample) | 2.8% | 2.7% |
| Standard Deviation (Population) | 2.8% | 2.6% |
Demographics Similar to Albanians and West Indians by Disability Age 18 to 34
In terms of disability age 18 to 34, the demographic groups most similar to Albanians are Moroccan (6.4%, a difference of 0.0%), Immigrants from Latvia (6.4%, a difference of 0.17%), South American Indian (6.4%, a difference of 0.19%), Jamaican (6.4%, a difference of 0.22%), and Immigrants from Fiji (6.4%, a difference of 0.31%). Similarly, the demographic groups most similar to West Indians are Chinese (6.3%, a difference of 0.010%), Immigrants from Switzerland (6.3%, a difference of 0.14%), Macedonian (6.3%, a difference of 0.16%), Immigrants from Italy (6.3%, a difference of 0.32%), and Immigrants from Dominica (6.3%, a difference of 0.33%).
| Demographics | Rating | Rank | Disability Age 18 to 34 |
| Macedonians | 92.6 /100 | #125 | Exceptional 6.3% |
| Immigrants | Switzerland | 92.5 /100 | #126 | Exceptional 6.3% |
| West Indians | 92.0 /100 | #127 | Exceptional 6.3% |
| Chinese | 91.9 /100 | #128 | Exceptional 6.3% |
| Immigrants | Italy | 90.5 /100 | #129 | Exceptional 6.3% |
| Immigrants | Dominica | 90.5 /100 | #130 | Exceptional 6.3% |
| Immigrants | Saudi Arabia | 90.4 /100 | #131 | Exceptional 6.3% |
| Guatemalans | 89.6 /100 | #132 | Excellent 6.4% |
| Brazilians | 89.0 /100 | #133 | Excellent 6.4% |
| Immigrants | Europe | 88.8 /100 | #134 | Excellent 6.4% |
| Palestinians | 88.5 /100 | #135 | Excellent 6.4% |
| Immigrants | Sweden | 88.5 /100 | #136 | Excellent 6.4% |
| Immigrants | Honduras | 87.7 /100 | #137 | Excellent 6.4% |
| Spanish American Indians | 87.7 /100 | #138 | Excellent 6.4% |
| Immigrants | Belize | 87.4 /100 | #139 | Excellent 6.4% |
| Immigrants | Fiji | 87.3 /100 | #140 | Excellent 6.4% |
| Jamaicans | 86.8 /100 | #141 | Excellent 6.4% |
| South American Indians | 86.5 /100 | #142 | Excellent 6.4% |
| Immigrants | Latvia | 86.4 /100 | #143 | Excellent 6.4% |
| Albanians | 85.3 /100 | #144 | Excellent 6.4% |
| Moroccans | 85.2 /100 | #145 | Excellent 6.4% |