Welsh vs Asian Disability Age 18 to 34
COMPARE
Welsh
Asian
Disability Age 18 to 34
Disability Age 18 to 34 Comparison
Welsh
Asians
7.7%
DISABILITY AGE 18 TO 34
0.0/ 100
METRIC RATING
302nd/ 347
METRIC RANK
5.8%
DISABILITY AGE 18 TO 34
99.9/ 100
METRIC RATING
39th/ 347
METRIC RANK
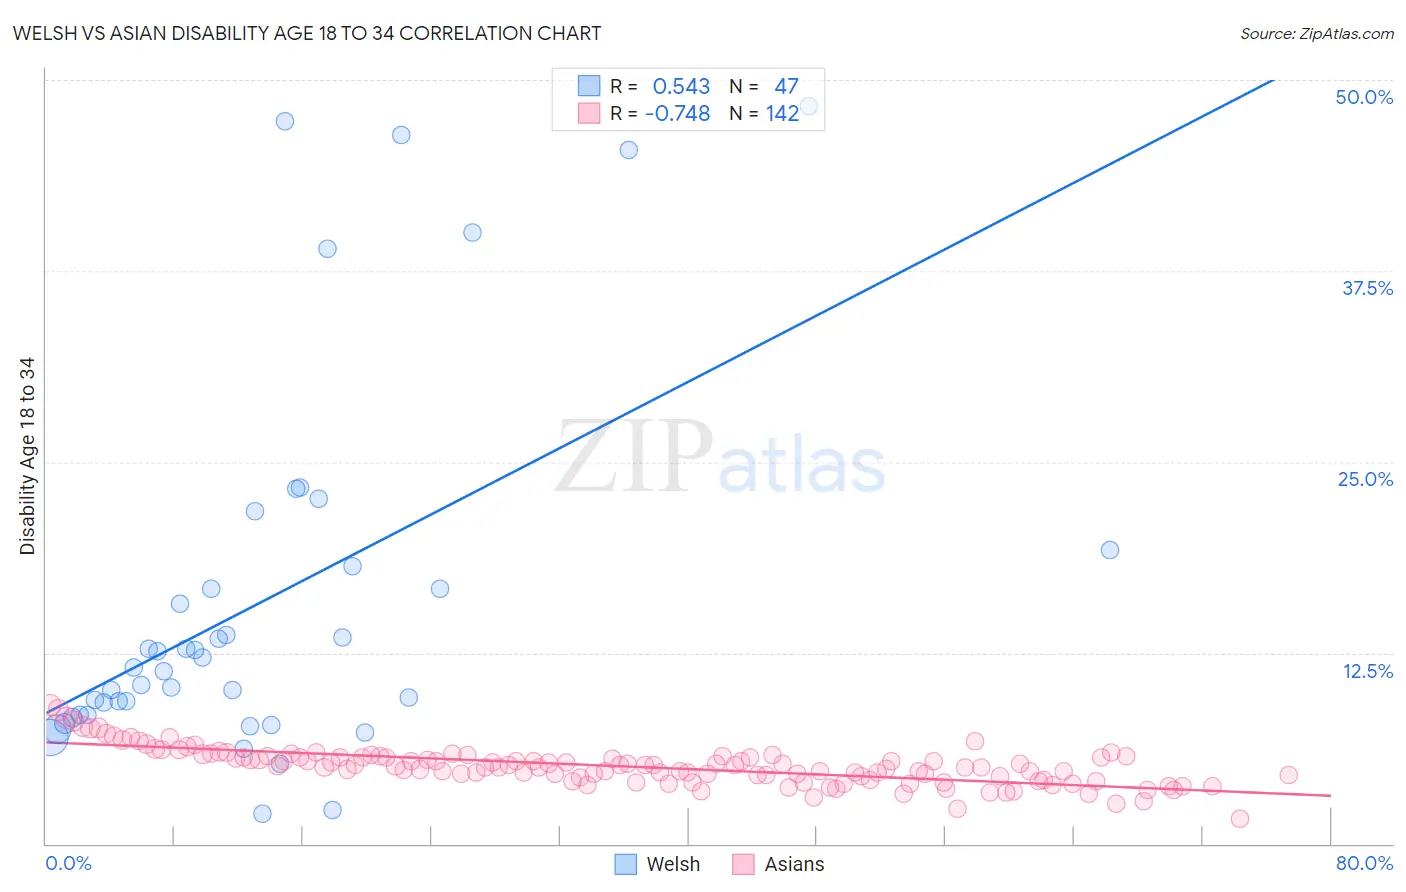
Welsh vs Asian Disability Age 18 to 34 Correlation Chart
The statistical analysis conducted on geographies consisting of 524,899,929 people shows a substantial positive correlation between the proportion of Welsh and percentage of population with a disability between the ages 18 and 35 in the United States with a correlation coefficient (R) of 0.543 and weighted average of 7.7%. Similarly, the statistical analysis conducted on geographies consisting of 547,285,512 people shows a strong negative correlation between the proportion of Asians and percentage of population with a disability between the ages 18 and 35 in the United States with a correlation coefficient (R) of -0.748 and weighted average of 5.8%, a difference of 32.8%.
Disability Age 18 to 34 Correlation Summary
| Measurement | Welsh | Asian |
| Minimum | 1.9% | 1.6% |
| Maximum | 48.3% | 9.1% |
| Range | 46.3% | 7.5% |
| Mean | 15.8% | 5.1% |
| Median | 11.6% | 5.1% |
| Interquartile 25% (IQ1) | 8.5% | 4.4% |
| Interquartile 75% (IQ3) | 18.2% | 5.7% |
| Interquartile Range (IQR) | 9.7% | 1.3% |
| Standard Deviation (Sample) | 12.2% | 1.2% |
| Standard Deviation (Population) | 12.0% | 1.2% |
Similar Demographics by Disability Age 18 to 34
Demographics Similar to Welsh by Disability Age 18 to 34
In terms of disability age 18 to 34, the demographic groups most similar to Welsh are Cheyenne (7.7%, a difference of 0.060%), Pima (7.7%, a difference of 0.070%), Scottish (7.7%, a difference of 0.14%), German (7.7%, a difference of 0.15%), and Dutch (7.7%, a difference of 0.39%).
| Demographics | Rating | Rank | Disability Age 18 to 34 |
| Tlingit-Haida | 0.0 /100 | #295 | Tragic 7.7% |
| Cape Verdeans | 0.0 /100 | #296 | Tragic 7.7% |
| Pueblo | 0.0 /100 | #297 | Tragic 7.7% |
| Dutch | 0.0 /100 | #298 | Tragic 7.7% |
| Germans | 0.0 /100 | #299 | Tragic 7.7% |
| Scottish | 0.0 /100 | #300 | Tragic 7.7% |
| Pima | 0.0 /100 | #301 | Tragic 7.7% |
| Welsh | 0.0 /100 | #302 | Tragic 7.7% |
| Cheyenne | 0.0 /100 | #303 | Tragic 7.7% |
| Shoshone | 0.0 /100 | #304 | Tragic 7.8% |
| Menominee | 0.0 /100 | #305 | Tragic 7.8% |
| English | 0.0 /100 | #306 | Tragic 7.8% |
| Scotch-Irish | 0.0 /100 | #307 | Tragic 7.8% |
| Pennsylvania Germans | 0.0 /100 | #308 | Tragic 7.8% |
| Alaska Natives | 0.0 /100 | #309 | Tragic 7.8% |
Demographics Similar to Asians by Disability Age 18 to 34
In terms of disability age 18 to 34, the demographic groups most similar to Asians are Bolivian (5.8%, a difference of 0.080%), Nicaraguan (5.8%, a difference of 0.26%), Immigrants from South America (5.8%, a difference of 0.30%), Armenian (5.8%, a difference of 0.33%), and Ecuadorian (5.8%, a difference of 0.42%).
| Demographics | Rating | Rank | Disability Age 18 to 34 |
| Immigrants | Barbados | 99.9 /100 | #32 | Exceptional 5.8% |
| Argentineans | 99.9 /100 | #33 | Exceptional 5.8% |
| Venezuelans | 99.9 /100 | #34 | Exceptional 5.8% |
| Immigrants | Lithuania | 99.9 /100 | #35 | Exceptional 5.8% |
| Ecuadorians | 99.9 /100 | #36 | Exceptional 5.8% |
| Armenians | 99.9 /100 | #37 | Exceptional 5.8% |
| Immigrants | South America | 99.9 /100 | #38 | Exceptional 5.8% |
| Asians | 99.9 /100 | #39 | Exceptional 5.8% |
| Bolivians | 99.9 /100 | #40 | Exceptional 5.8% |
| Nicaraguans | 99.9 /100 | #41 | Exceptional 5.8% |
| Colombians | 99.8 /100 | #42 | Exceptional 5.9% |
| South Americans | 99.8 /100 | #43 | Exceptional 5.9% |
| Immigrants | Asia | 99.8 /100 | #44 | Exceptional 5.9% |
| Immigrants | Peru | 99.8 /100 | #45 | Exceptional 5.9% |
| Immigrants | Korea | 99.8 /100 | #46 | Exceptional 5.9% |