Vietnamese vs Immigrants from Belgium Disability Age Under 5
COMPARE
Vietnamese
Immigrants from Belgium
Disability Age Under 5
Disability Age Under 5 Comparison
Vietnamese
Immigrants from Belgium
0.81%
DISABILITY AGE UNDER 5
100.0/ 100
METRIC RATING
3rd/ 347
METRIC RANK
1.3%
DISABILITY AGE UNDER 5
31.4/ 100
METRIC RATING
196th/ 347
METRIC RANK
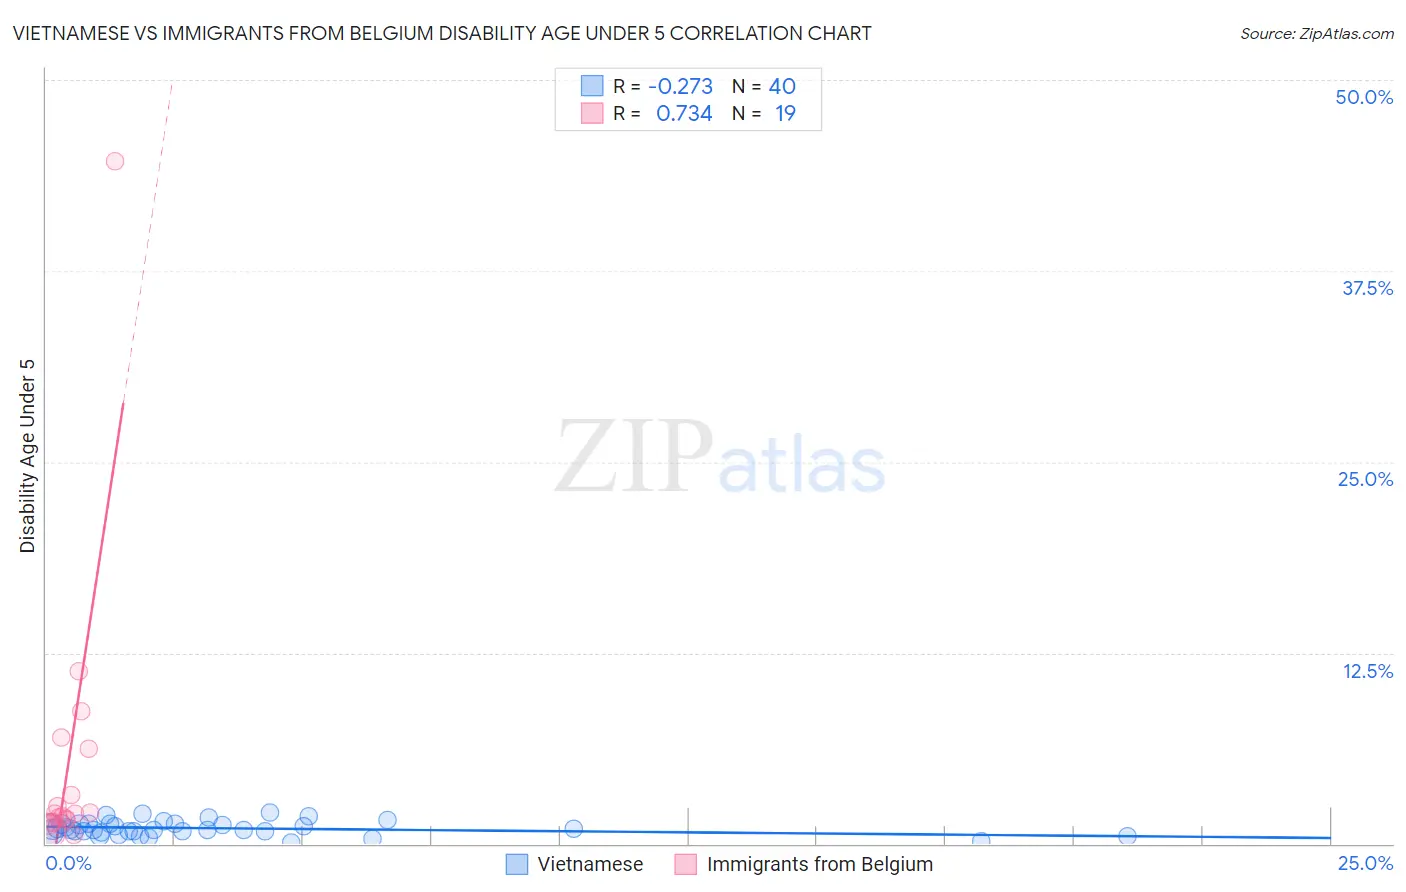
Vietnamese vs Immigrants from Belgium Disability Age Under 5 Correlation Chart
The statistical analysis conducted on geographies consisting of 116,197,167 people shows a weak negative correlation between the proportion of Vietnamese and percentage of population with a disability under the age of 5 in the United States with a correlation coefficient (R) of -0.273 and weighted average of 0.81%. Similarly, the statistical analysis conducted on geographies consisting of 103,751,035 people shows a strong positive correlation between the proportion of Immigrants from Belgium and percentage of population with a disability under the age of 5 in the United States with a correlation coefficient (R) of 0.734 and weighted average of 1.3%, a difference of 55.4%.
Disability Age Under 5 Correlation Summary
| Measurement | Vietnamese | Immigrants from Belgium |
| Minimum | 0.070% | 0.56% |
| Maximum | 2.0% | 44.7% |
| Range | 2.0% | 44.1% |
| Mean | 1.0% | 5.3% |
| Median | 0.93% | 1.9% |
| Interquartile 25% (IQ1) | 0.79% | 1.4% |
| Interquartile 75% (IQ3) | 1.3% | 6.2% |
| Interquartile Range (IQR) | 0.50% | 4.8% |
| Standard Deviation (Sample) | 0.47% | 10.0% |
| Standard Deviation (Population) | 0.46% | 9.7% |
Similar Demographics by Disability Age Under 5
Demographics Similar to Vietnamese by Disability Age Under 5
In terms of disability age under 5, the demographic groups most similar to Vietnamese are Immigrants from St. Vincent and the Grenadines (0.79%, a difference of 3.2%), Immigrants from Uzbekistan (0.85%, a difference of 4.6%), Immigrants from Bangladesh (0.85%, a difference of 5.0%), Ute (0.86%, a difference of 6.0%), and Immigrants from Armenia (0.76%, a difference of 7.4%).
| Demographics | Rating | Rank | Disability Age Under 5 |
| Immigrants | Armenia | 100.0 /100 | #1 | Exceptional 0.76% |
| Immigrants | St. Vincent and the Grenadines | 100.0 /100 | #2 | Exceptional 0.79% |
| Vietnamese | 100.0 /100 | #3 | Exceptional 0.81% |
| Immigrants | Uzbekistan | 100.0 /100 | #4 | Exceptional 0.85% |
| Immigrants | Bangladesh | 100.0 /100 | #5 | Exceptional 0.85% |
| Ute | 100.0 /100 | #6 | Exceptional 0.86% |
| Immigrants | Afghanistan | 100.0 /100 | #7 | Exceptional 0.91% |
| Immigrants | Yemen | 100.0 /100 | #8 | Exceptional 0.91% |
| Immigrants | Fiji | 100.0 /100 | #9 | Exceptional 0.92% |
| Marshallese | 100.0 /100 | #10 | Exceptional 0.94% |
| Afghans | 100.0 /100 | #11 | Exceptional 0.94% |
| Immigrants | Grenada | 100.0 /100 | #12 | Exceptional 0.94% |
| Soviet Union | 100.0 /100 | #13 | Exceptional 0.95% |
| Yuman | 100.0 /100 | #14 | Exceptional 0.95% |
| Immigrants | Hong Kong | 100.0 /100 | #15 | Exceptional 0.95% |
Demographics Similar to Immigrants from Belgium by Disability Age Under 5
In terms of disability age under 5, the demographic groups most similar to Immigrants from Belgium are Immigrants from Somalia (1.3%, a difference of 0.010%), Immigrants from Norway (1.3%, a difference of 0.040%), Jamaican (1.3%, a difference of 0.080%), U.S. Virgin Islander (1.3%, a difference of 0.30%), and Immigrants from North Macedonia (1.3%, a difference of 0.33%).
| Demographics | Rating | Rank | Disability Age Under 5 |
| Peruvians | 37.6 /100 | #189 | Fair 1.3% |
| Immigrants | Laos | 36.6 /100 | #190 | Fair 1.3% |
| Mexican American Indians | 36.6 /100 | #191 | Fair 1.3% |
| Immigrants | Bosnia and Herzegovina | 36.5 /100 | #192 | Fair 1.3% |
| Immigrants | Sierra Leone | 36.5 /100 | #193 | Fair 1.3% |
| Immigrants | North Macedonia | 34.7 /100 | #194 | Fair 1.3% |
| U.S. Virgin Islanders | 34.4 /100 | #195 | Fair 1.3% |
| Immigrants | Belgium | 31.4 /100 | #196 | Fair 1.3% |
| Immigrants | Somalia | 31.3 /100 | #197 | Fair 1.3% |
| Immigrants | Norway | 31.1 /100 | #198 | Fair 1.3% |
| Jamaicans | 30.7 /100 | #199 | Fair 1.3% |
| Immigrants | Lithuania | 27.2 /100 | #200 | Fair 1.3% |
| Immigrants | Italy | 25.4 /100 | #201 | Fair 1.3% |
| Arapaho | 24.1 /100 | #202 | Fair 1.3% |
| Liberians | 24.0 /100 | #203 | Fair 1.3% |