Burmese vs Immigrants from Belgium Disability Age Under 5
COMPARE
Burmese
Immigrants from Belgium
Disability Age Under 5
Disability Age Under 5 Comparison
Burmese
Immigrants from Belgium
1.1%
DISABILITY AGE UNDER 5
98.5/ 100
METRIC RATING
72nd/ 347
METRIC RANK
1.3%
DISABILITY AGE UNDER 5
31.4/ 100
METRIC RATING
196th/ 347
METRIC RANK
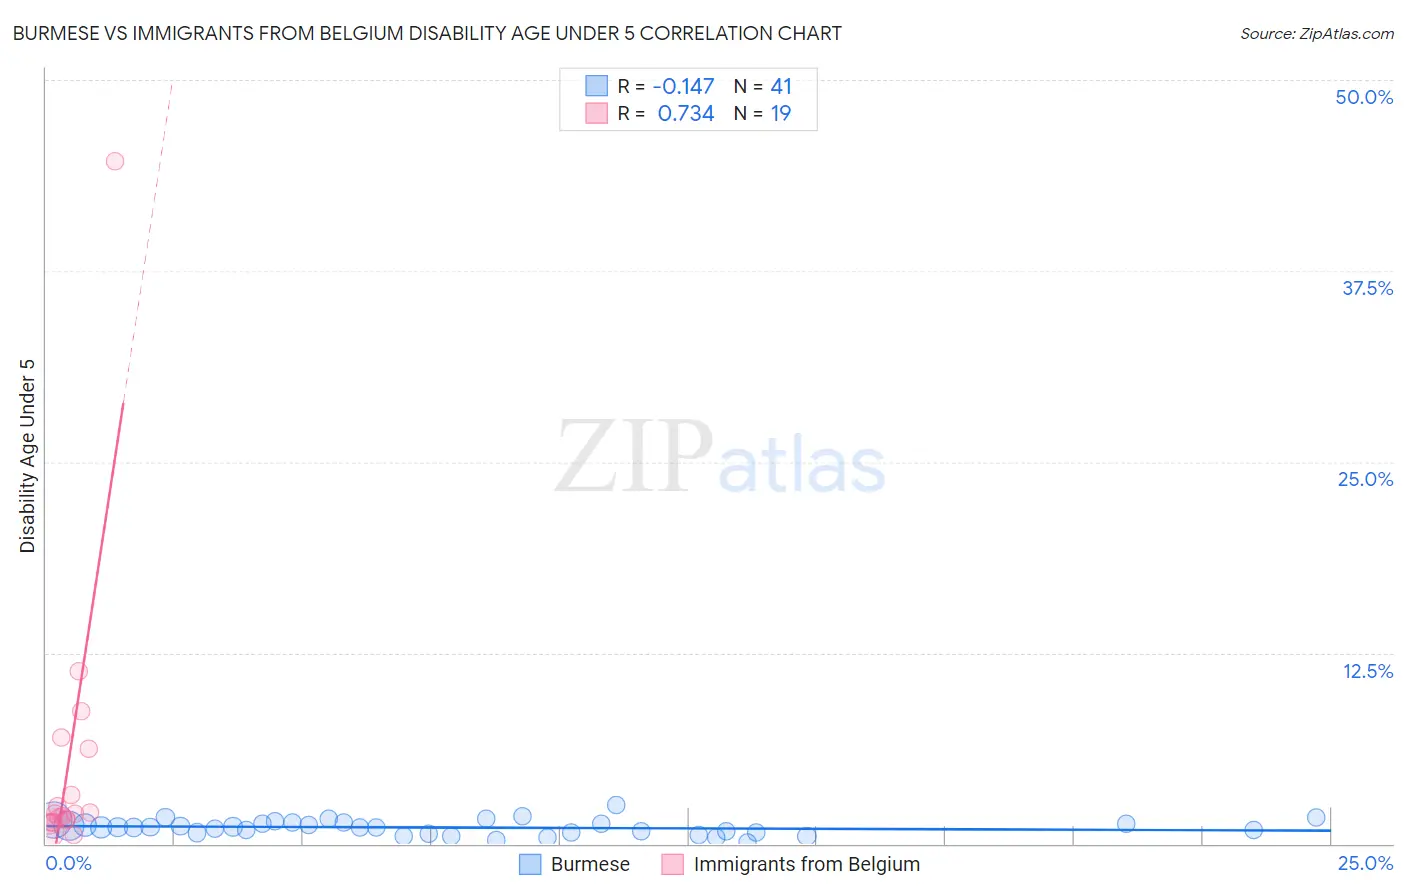
Burmese vs Immigrants from Belgium Disability Age Under 5 Correlation Chart
The statistical analysis conducted on geographies consisting of 238,564,185 people shows a poor negative correlation between the proportion of Burmese and percentage of population with a disability under the age of 5 in the United States with a correlation coefficient (R) of -0.147 and weighted average of 1.1%. Similarly, the statistical analysis conducted on geographies consisting of 103,751,035 people shows a strong positive correlation between the proportion of Immigrants from Belgium and percentage of population with a disability under the age of 5 in the United States with a correlation coefficient (R) of 0.734 and weighted average of 1.3%, a difference of 12.4%.
Disability Age Under 5 Correlation Summary
| Measurement | Burmese | Immigrants from Belgium |
| Minimum | 0.058% | 0.56% |
| Maximum | 2.5% | 44.7% |
| Range | 2.5% | 44.1% |
| Mean | 1.1% | 5.3% |
| Median | 1.1% | 1.9% |
| Interquartile 25% (IQ1) | 0.72% | 1.4% |
| Interquartile 75% (IQ3) | 1.4% | 6.2% |
| Interquartile Range (IQR) | 0.63% | 4.8% |
| Standard Deviation (Sample) | 0.49% | 10.0% |
| Standard Deviation (Population) | 0.48% | 9.7% |
Similar Demographics by Disability Age Under 5
Demographics Similar to Burmese by Disability Age Under 5
In terms of disability age under 5, the demographic groups most similar to Burmese are Immigrants from Sri Lanka (1.1%, a difference of 0.080%), Jordanian (1.1%, a difference of 0.090%), Trinidadian and Tobagonian (1.1%, a difference of 0.16%), Immigrants from Pakistan (1.1%, a difference of 0.17%), and Immigrants from Ecuador (1.1%, a difference of 0.22%).
| Demographics | Rating | Rank | Disability Age Under 5 |
| Immigrants | Korea | 98.8 /100 | #65 | Exceptional 1.1% |
| Immigrants | Indonesia | 98.7 /100 | #66 | Exceptional 1.1% |
| Immigrants | Belize | 98.7 /100 | #67 | Exceptional 1.1% |
| South Africans | 98.7 /100 | #68 | Exceptional 1.1% |
| Israelis | 98.7 /100 | #69 | Exceptional 1.1% |
| Immigrants | Ecuador | 98.6 /100 | #70 | Exceptional 1.1% |
| Trinidadians and Tobagonians | 98.6 /100 | #71 | Exceptional 1.1% |
| Burmese | 98.5 /100 | #72 | Exceptional 1.1% |
| Immigrants | Sri Lanka | 98.5 /100 | #73 | Exceptional 1.1% |
| Jordanians | 98.5 /100 | #74 | Exceptional 1.1% |
| Immigrants | Pakistan | 98.4 /100 | #75 | Exceptional 1.1% |
| Immigrants | Burma/Myanmar | 98.2 /100 | #76 | Exceptional 1.1% |
| Immigrants | Denmark | 98.1 /100 | #77 | Exceptional 1.1% |
| West Indians | 98.0 /100 | #78 | Exceptional 1.1% |
| Hmong | 98.0 /100 | #79 | Exceptional 1.1% |
Demographics Similar to Immigrants from Belgium by Disability Age Under 5
In terms of disability age under 5, the demographic groups most similar to Immigrants from Belgium are Immigrants from Somalia (1.3%, a difference of 0.010%), Immigrants from Norway (1.3%, a difference of 0.040%), Jamaican (1.3%, a difference of 0.080%), U.S. Virgin Islander (1.3%, a difference of 0.30%), and Immigrants from North Macedonia (1.3%, a difference of 0.33%).
| Demographics | Rating | Rank | Disability Age Under 5 |
| Peruvians | 37.6 /100 | #189 | Fair 1.3% |
| Immigrants | Laos | 36.6 /100 | #190 | Fair 1.3% |
| Mexican American Indians | 36.6 /100 | #191 | Fair 1.3% |
| Immigrants | Bosnia and Herzegovina | 36.5 /100 | #192 | Fair 1.3% |
| Immigrants | Sierra Leone | 36.5 /100 | #193 | Fair 1.3% |
| Immigrants | North Macedonia | 34.7 /100 | #194 | Fair 1.3% |
| U.S. Virgin Islanders | 34.4 /100 | #195 | Fair 1.3% |
| Immigrants | Belgium | 31.4 /100 | #196 | Fair 1.3% |
| Immigrants | Somalia | 31.3 /100 | #197 | Fair 1.3% |
| Immigrants | Norway | 31.1 /100 | #198 | Fair 1.3% |
| Jamaicans | 30.7 /100 | #199 | Fair 1.3% |
| Immigrants | Lithuania | 27.2 /100 | #200 | Fair 1.3% |
| Immigrants | Italy | 25.4 /100 | #201 | Fair 1.3% |
| Arapaho | 24.1 /100 | #202 | Fair 1.3% |
| Liberians | 24.0 /100 | #203 | Fair 1.3% |