U.S. Virgin Islander vs Immigrants from India Male Disability
COMPARE
U.S. Virgin Islander
Immigrants from India
Male Disability
Male Disability Comparison
U.S. Virgin Islanders
Immigrants from India
11.9%
MALE DISABILITY
1.3/ 100
METRIC RATING
236th/ 347
METRIC RANK
9.0%
MALE DISABILITY
100.0/ 100
METRIC RATING
1st/ 347
METRIC RANK
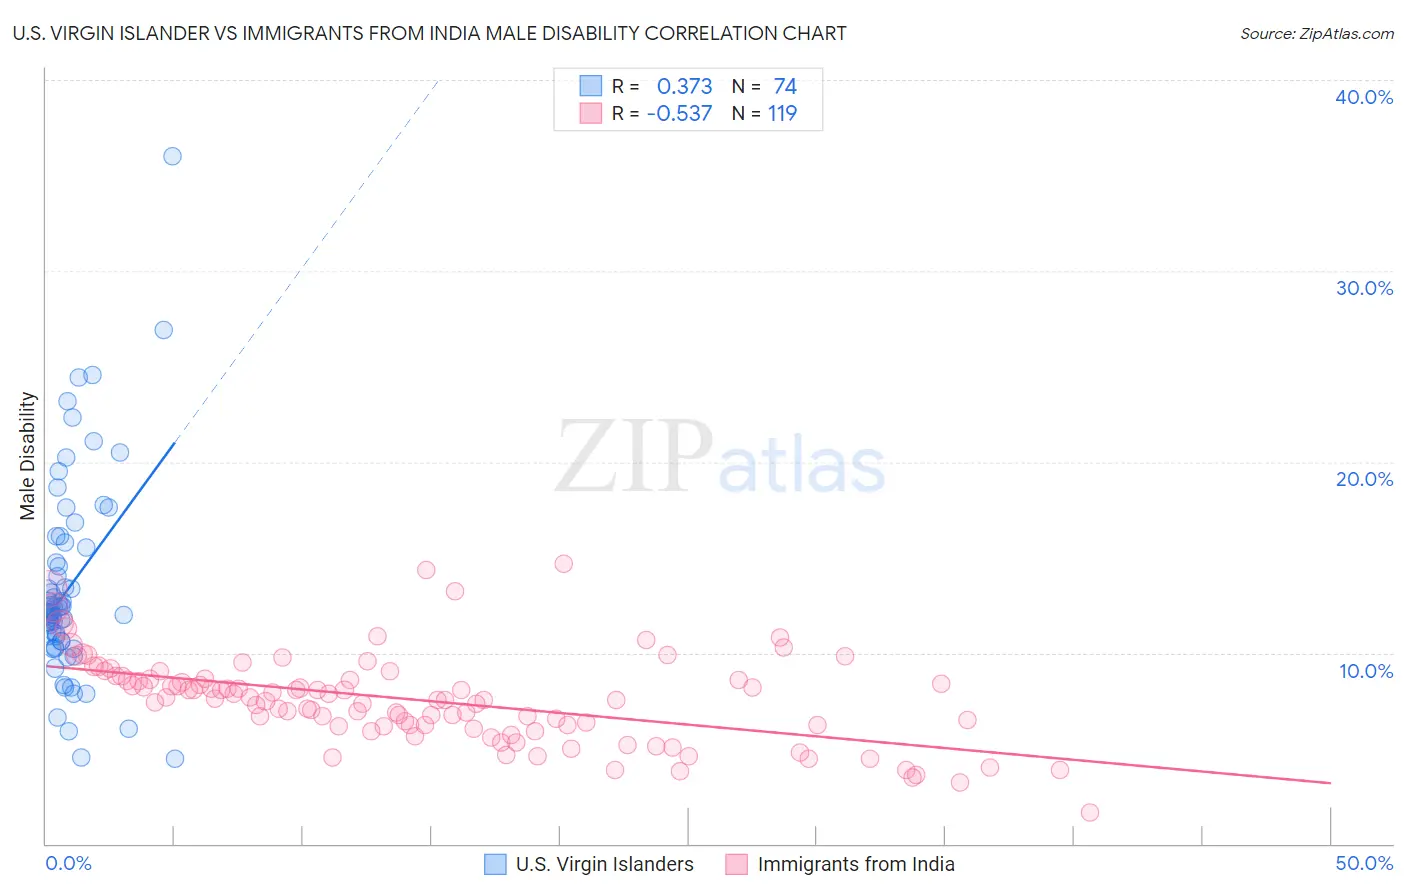
U.S. Virgin Islander vs Immigrants from India Male Disability Correlation Chart
The statistical analysis conducted on geographies consisting of 87,521,484 people shows a mild positive correlation between the proportion of U.S. Virgin Islanders and percentage of males with a disability in the United States with a correlation coefficient (R) of 0.373 and weighted average of 11.9%. Similarly, the statistical analysis conducted on geographies consisting of 434,062,130 people shows a substantial negative correlation between the proportion of Immigrants from India and percentage of males with a disability in the United States with a correlation coefficient (R) of -0.537 and weighted average of 9.0%, a difference of 31.6%.
Male Disability Correlation Summary
| Measurement | U.S. Virgin Islander | Immigrants from India |
| Minimum | 4.4% | 1.6% |
| Maximum | 36.0% | 14.7% |
| Range | 31.6% | 13.0% |
| Mean | 13.4% | 7.5% |
| Median | 12.1% | 7.6% |
| Interquartile 25% (IQ1) | 10.6% | 6.2% |
| Interquartile 75% (IQ3) | 15.5% | 8.6% |
| Interquartile Range (IQR) | 4.9% | 2.5% |
| Standard Deviation (Sample) | 5.3% | 2.3% |
| Standard Deviation (Population) | 5.3% | 2.3% |
Similar Demographics by Male Disability
Demographics Similar to U.S. Virgin Islanders by Male Disability
In terms of male disability, the demographic groups most similar to U.S. Virgin Islanders are Carpatho Rusyn (11.9%, a difference of 0.010%), Yugoslavian (11.9%, a difference of 0.11%), Immigrants from North America (11.9%, a difference of 0.14%), Italian (11.9%, a difference of 0.16%), and Czech (11.9%, a difference of 0.21%).
| Demographics | Rating | Rank | Male Disability |
| Bermudans | 2.3 /100 | #229 | Tragic 11.8% |
| Croatians | 2.1 /100 | #230 | Tragic 11.8% |
| Dominicans | 1.8 /100 | #231 | Tragic 11.8% |
| Malaysians | 1.8 /100 | #232 | Tragic 11.8% |
| Mexicans | 1.7 /100 | #233 | Tragic 11.8% |
| Immigrants | Canada | 1.6 /100 | #234 | Tragic 11.9% |
| Immigrants | North America | 1.5 /100 | #235 | Tragic 11.9% |
| U.S. Virgin Islanders | 1.3 /100 | #236 | Tragic 11.9% |
| Carpatho Rusyns | 1.3 /100 | #237 | Tragic 11.9% |
| Yugoslavians | 1.2 /100 | #238 | Tragic 11.9% |
| Italians | 1.2 /100 | #239 | Tragic 11.9% |
| Czechs | 1.1 /100 | #240 | Tragic 11.9% |
| Bahamians | 1.1 /100 | #241 | Tragic 11.9% |
| Northern Europeans | 1.1 /100 | #242 | Tragic 11.9% |
| Samoans | 1.1 /100 | #243 | Tragic 11.9% |
Demographics Similar to Immigrants from India by Male Disability
In terms of male disability, the demographic groups most similar to Immigrants from India are Immigrants from Taiwan (9.1%, a difference of 0.89%), Filipino (9.1%, a difference of 0.90%), Thai (9.2%, a difference of 2.2%), Immigrants from Hong Kong (9.4%, a difference of 4.4%), and Immigrants from South Central Asia (9.4%, a difference of 4.4%).
| Demographics | Rating | Rank | Male Disability |
| Immigrants | India | 100.0 /100 | #1 | Exceptional 9.0% |
| Immigrants | Taiwan | 100.0 /100 | #2 | Exceptional 9.1% |
| Filipinos | 100.0 /100 | #3 | Exceptional 9.1% |
| Thais | 100.0 /100 | #4 | Exceptional 9.2% |
| Immigrants | Hong Kong | 100.0 /100 | #5 | Exceptional 9.4% |
| Immigrants | South Central Asia | 100.0 /100 | #6 | Exceptional 9.4% |
| Immigrants | Bolivia | 100.0 /100 | #7 | Exceptional 9.5% |
| Immigrants | China | 100.0 /100 | #8 | Exceptional 9.5% |
| Immigrants | Singapore | 100.0 /100 | #9 | Exceptional 9.5% |
| Immigrants | Israel | 100.0 /100 | #10 | Exceptional 9.6% |
| Immigrants | Eastern Asia | 100.0 /100 | #11 | Exceptional 9.6% |
| Bolivians | 100.0 /100 | #12 | Exceptional 9.6% |
| Iranians | 100.0 /100 | #13 | Exceptional 9.7% |
| Immigrants | Iran | 100.0 /100 | #14 | Exceptional 9.7% |
| Indians (Asian) | 100.0 /100 | #15 | Exceptional 9.7% |