Uruguayan vs Immigrants from Northern Europe Vision Disability
COMPARE
Uruguayan
Immigrants from Northern Europe
Vision Disability
Vision Disability Comparison
Uruguayans
Immigrants from Northern Europe
2.2%
VISION DISABILITY
42.7/ 100
METRIC RATING
180th/ 347
METRIC RANK
2.0%
VISION DISABILITY
98.6/ 100
METRIC RATING
71st/ 347
METRIC RANK
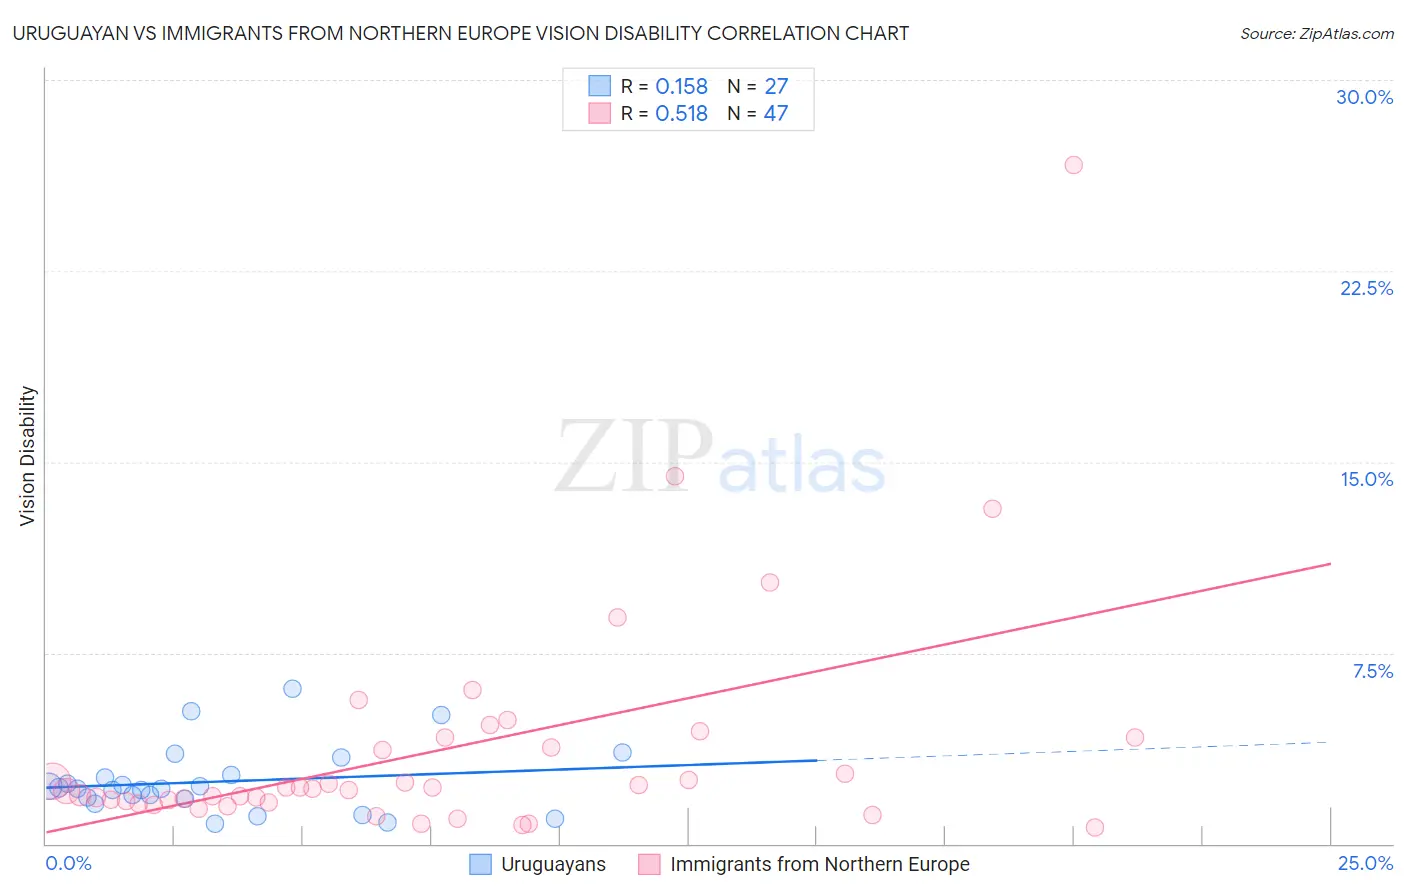
Uruguayan vs Immigrants from Northern Europe Vision Disability Correlation Chart
The statistical analysis conducted on geographies consisting of 144,772,408 people shows a poor positive correlation between the proportion of Uruguayans and percentage of population with vision disability in the United States with a correlation coefficient (R) of 0.158 and weighted average of 2.2%. Similarly, the statistical analysis conducted on geographies consisting of 476,530,076 people shows a substantial positive correlation between the proportion of Immigrants from Northern Europe and percentage of population with vision disability in the United States with a correlation coefficient (R) of 0.518 and weighted average of 2.0%, a difference of 7.6%.
Vision Disability Correlation Summary
| Measurement | Uruguayan | Immigrants from Northern Europe |
| Minimum | 0.80% | 0.66% |
| Maximum | 6.1% | 26.7% |
| Range | 5.3% | 26.0% |
| Mean | 2.4% | 3.7% |
| Median | 2.1% | 2.2% |
| Interquartile 25% (IQ1) | 1.8% | 1.6% |
| Interquartile 75% (IQ3) | 2.7% | 4.2% |
| Interquartile Range (IQR) | 0.93% | 2.5% |
| Standard Deviation (Sample) | 1.3% | 4.5% |
| Standard Deviation (Population) | 1.3% | 4.5% |
Similar Demographics by Vision Disability
Demographics Similar to Uruguayans by Vision Disability
In terms of vision disability, the demographic groups most similar to Uruguayans are Immigrants from Western Europe (2.2%, a difference of 0.10%), Immigrants from North America (2.2%, a difference of 0.12%), Costa Rican (2.2%, a difference of 0.13%), Immigrants from Oceania (2.2%, a difference of 0.16%), and Slavic (2.2%, a difference of 0.21%).
| Demographics | Rating | Rank | Vision Disability |
| Scandinavians | 50.0 /100 | #173 | Average 2.2% |
| Immigrants | Canada | 50.0 /100 | #174 | Average 2.2% |
| Immigrants | Fiji | 47.6 /100 | #175 | Average 2.2% |
| Yugoslavians | 46.5 /100 | #176 | Average 2.2% |
| Slavs | 46.0 /100 | #177 | Average 2.2% |
| Immigrants | Oceania | 45.1 /100 | #178 | Average 2.2% |
| Immigrants | North America | 44.5 /100 | #179 | Average 2.2% |
| Uruguayans | 42.7 /100 | #180 | Average 2.2% |
| Immigrants | Western Europe | 41.1 /100 | #181 | Average 2.2% |
| Costa Ricans | 40.7 /100 | #182 | Average 2.2% |
| Immigrants | Burma/Myanmar | 37.9 /100 | #183 | Fair 2.2% |
| Moroccans | 35.4 /100 | #184 | Fair 2.2% |
| Immigrants | Middle Africa | 33.5 /100 | #185 | Fair 2.2% |
| Native Hawaiians | 33.3 /100 | #186 | Fair 2.2% |
| Immigrants | St. Vincent and the Grenadines | 30.3 /100 | #187 | Fair 2.2% |
Demographics Similar to Immigrants from Northern Europe by Vision Disability
In terms of vision disability, the demographic groups most similar to Immigrants from Northern Europe are Immigrants from Kazakhstan (2.0%, a difference of 0.010%), Russian (2.0%, a difference of 0.030%), Immigrants from France (2.0%, a difference of 0.050%), Immigrants from Czechoslovakia (2.0%, a difference of 0.20%), and Immigrants from Eritrea (2.0%, a difference of 0.25%).
| Demographics | Rating | Rank | Vision Disability |
| Immigrants | Greece | 99.0 /100 | #64 | Exceptional 2.0% |
| Maltese | 98.9 /100 | #65 | Exceptional 2.0% |
| Immigrants | Argentina | 98.9 /100 | #66 | Exceptional 2.0% |
| Immigrants | Northern Africa | 98.8 /100 | #67 | Exceptional 2.0% |
| Immigrants | Czechoslovakia | 98.7 /100 | #68 | Exceptional 2.0% |
| Russians | 98.6 /100 | #69 | Exceptional 2.0% |
| Immigrants | Kazakhstan | 98.6 /100 | #70 | Exceptional 2.0% |
| Immigrants | Northern Europe | 98.6 /100 | #71 | Exceptional 2.0% |
| Immigrants | France | 98.5 /100 | #72 | Exceptional 2.0% |
| Immigrants | Eritrea | 98.4 /100 | #73 | Exceptional 2.0% |
| Palestinians | 98.3 /100 | #74 | Exceptional 2.0% |
| Immigrants | North Macedonia | 98.3 /100 | #75 | Exceptional 2.0% |
| Paraguayans | 98.3 /100 | #76 | Exceptional 2.0% |
| Immigrants | Jordan | 98.3 /100 | #77 | Exceptional 2.0% |
| Immigrants | Eastern Europe | 98.3 /100 | #78 | Exceptional 2.0% |