Uruguayan vs Immigrants from Kuwait Vision Disability
COMPARE
Uruguayan
Immigrants from Kuwait
Vision Disability
Vision Disability Comparison
Uruguayans
Immigrants from Kuwait
2.2%
VISION DISABILITY
42.7/ 100
METRIC RATING
180th/ 347
METRIC RANK
2.0%
VISION DISABILITY
99.8/ 100
METRIC RATING
38th/ 347
METRIC RANK
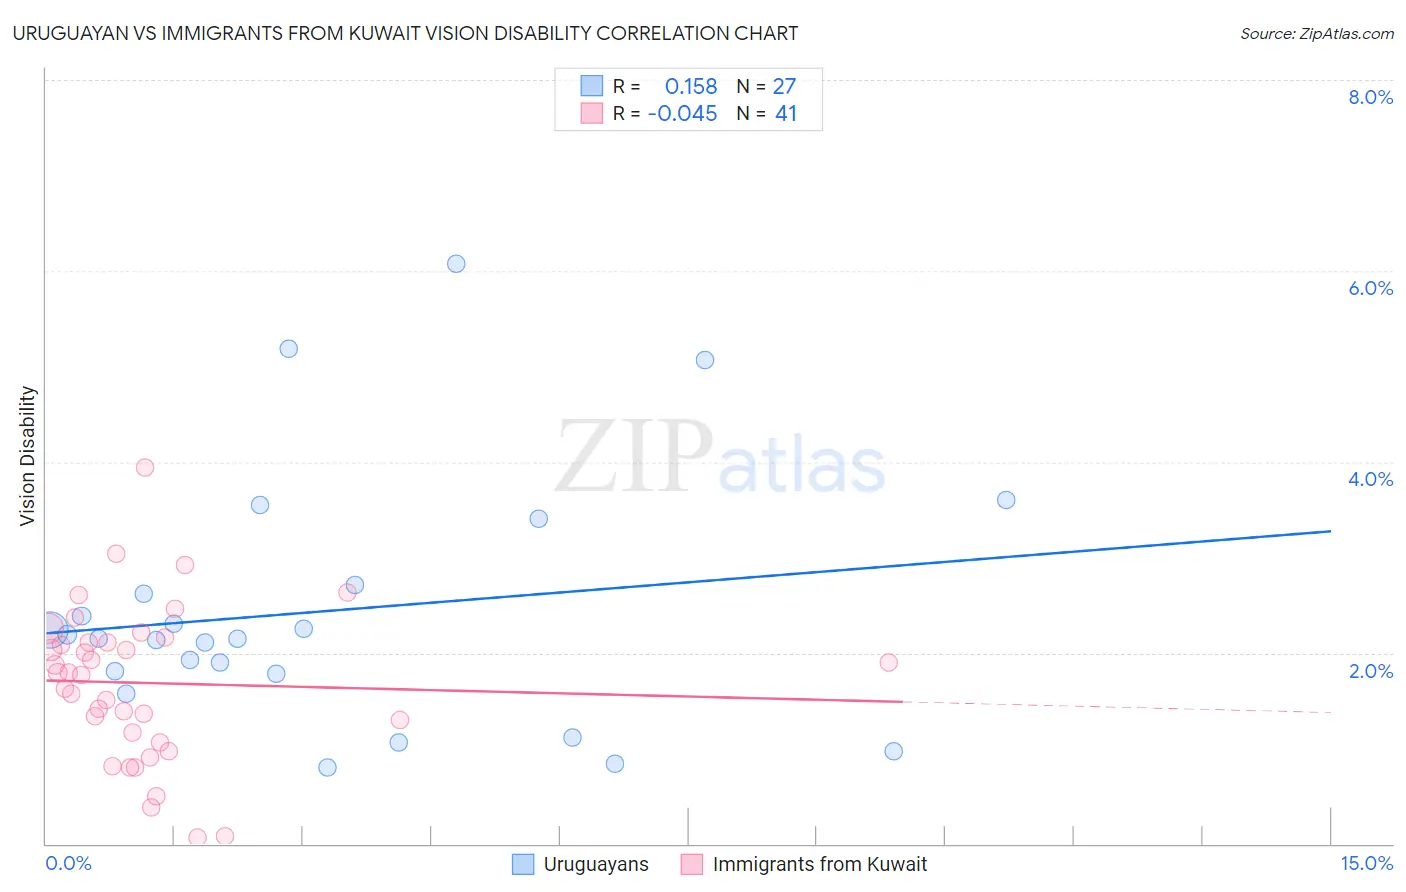
Uruguayan vs Immigrants from Kuwait Vision Disability Correlation Chart
The statistical analysis conducted on geographies consisting of 144,772,408 people shows a poor positive correlation between the proportion of Uruguayans and percentage of population with vision disability in the United States with a correlation coefficient (R) of 0.158 and weighted average of 2.2%. Similarly, the statistical analysis conducted on geographies consisting of 136,909,771 people shows no correlation between the proportion of Immigrants from Kuwait and percentage of population with vision disability in the United States with a correlation coefficient (R) of -0.045 and weighted average of 2.0%, a difference of 11.0%.
Vision Disability Correlation Summary
| Measurement | Uruguayan | Immigrants from Kuwait |
| Minimum | 0.80% | 0.068% |
| Maximum | 6.1% | 3.9% |
| Range | 5.3% | 3.9% |
| Mean | 2.4% | 1.7% |
| Median | 2.1% | 1.8% |
| Interquartile 25% (IQ1) | 1.8% | 1.1% |
| Interquartile 75% (IQ3) | 2.7% | 2.1% |
| Interquartile Range (IQR) | 0.93% | 1.0% |
| Standard Deviation (Sample) | 1.3% | 0.81% |
| Standard Deviation (Population) | 1.3% | 0.80% |
Similar Demographics by Vision Disability
Demographics Similar to Uruguayans by Vision Disability
In terms of vision disability, the demographic groups most similar to Uruguayans are Immigrants from Western Europe (2.2%, a difference of 0.10%), Immigrants from North America (2.2%, a difference of 0.12%), Costa Rican (2.2%, a difference of 0.13%), Immigrants from Oceania (2.2%, a difference of 0.16%), and Slavic (2.2%, a difference of 0.21%).
| Demographics | Rating | Rank | Vision Disability |
| Scandinavians | 50.0 /100 | #173 | Average 2.2% |
| Immigrants | Canada | 50.0 /100 | #174 | Average 2.2% |
| Immigrants | Fiji | 47.6 /100 | #175 | Average 2.2% |
| Yugoslavians | 46.5 /100 | #176 | Average 2.2% |
| Slavs | 46.0 /100 | #177 | Average 2.2% |
| Immigrants | Oceania | 45.1 /100 | #178 | Average 2.2% |
| Immigrants | North America | 44.5 /100 | #179 | Average 2.2% |
| Uruguayans | 42.7 /100 | #180 | Average 2.2% |
| Immigrants | Western Europe | 41.1 /100 | #181 | Average 2.2% |
| Costa Ricans | 40.7 /100 | #182 | Average 2.2% |
| Immigrants | Burma/Myanmar | 37.9 /100 | #183 | Fair 2.2% |
| Moroccans | 35.4 /100 | #184 | Fair 2.2% |
| Immigrants | Middle Africa | 33.5 /100 | #185 | Fair 2.2% |
| Native Hawaiians | 33.3 /100 | #186 | Fair 2.2% |
| Immigrants | St. Vincent and the Grenadines | 30.3 /100 | #187 | Fair 2.2% |
Demographics Similar to Immigrants from Kuwait by Vision Disability
In terms of vision disability, the demographic groups most similar to Immigrants from Kuwait are Bhutanese (2.0%, a difference of 0.040%), Zimbabwean (2.0%, a difference of 0.060%), Immigrants from Ireland (2.0%, a difference of 0.26%), Cypriot (2.0%, a difference of 0.28%), and Cambodian (2.0%, a difference of 0.29%).
| Demographics | Rating | Rank | Vision Disability |
| Mongolians | 99.9 /100 | #31 | Exceptional 1.9% |
| Luxembourgers | 99.9 /100 | #32 | Exceptional 1.9% |
| Immigrants | Egypt | 99.9 /100 | #33 | Exceptional 1.9% |
| Immigrants | Turkey | 99.8 /100 | #34 | Exceptional 1.9% |
| Immigrants | Australia | 99.8 /100 | #35 | Exceptional 1.9% |
| Cambodians | 99.8 /100 | #36 | Exceptional 2.0% |
| Bhutanese | 99.8 /100 | #37 | Exceptional 2.0% |
| Immigrants | Kuwait | 99.8 /100 | #38 | Exceptional 2.0% |
| Zimbabweans | 99.7 /100 | #39 | Exceptional 2.0% |
| Immigrants | Ireland | 99.7 /100 | #40 | Exceptional 2.0% |
| Cypriots | 99.7 /100 | #41 | Exceptional 2.0% |
| Immigrants | Ethiopia | 99.7 /100 | #42 | Exceptional 2.0% |
| Eastern Europeans | 99.7 /100 | #43 | Exceptional 2.0% |
| Immigrants | Indonesia | 99.7 /100 | #44 | Exceptional 2.0% |
| Ethiopians | 99.7 /100 | #45 | Exceptional 2.0% |