Ukrainian vs Immigrants from Jordan Disability Age Over 75

COMPARE

Ukrainian
Race
Ancestry
AfghanAfricanAlaska NativeAlaskan AthabascanAlbanianAleutAlsatianAmericanApacheArabArapahoArgentineanArmenianAssyrian/Chaldean/SyriacAustralianAustrianBahamianBangladeshiBarbadianBasqueBelgianBelizeanBermudanBhutaneseBlackfeetBolivianBrazilianBritishBritish West IndianBulgarianBurmeseCajunCambodianCanadianCape VerdeanCarpatho RusynCelticCentral AmericanCentral American IndianCherokeeCheyenneChickasawChileanChineseChippewaChoctawColombianColvilleComancheCosta RicanCreeCreekCroatianCrowCubanCypriotCzechCzechoslovakianDanishDelawareDominicanDutchDutch West IndianEastern EuropeanEcuadorianEgyptianEnglishEstonianEthiopianEuropeanFijianFilipinoFinnishFrenchFrench American IndianFrench CanadianGermanGerman RussianGhanaianGreekGuamanian/ChamorroGuatemalanGuyaneseHaitianHmongHonduranHopiHoumaHungarianIcelanderIndian (Asian)IndonesianInupiatIranianIraqiIrishIroquoisIsraeliItalianJamaicanJapaneseJordanianKenyanKiowaKoreanLaotianLatvianLebaneseLiberianLithuanianLumbeeLuxembourgerMacedonianMalaysianMalteseMarshalleseMenomineeMexicanMexican American IndianMongolianMoroccanNative HawaiianNavajoNepaleseNew ZealanderNicaraguanNigerianNorthern EuropeanNorwegianOkinawanOsageOttawaPaiutePakistaniPalestinianPanamanianParaguayanPennsylvania GermanPeruvianPimaPolishPortuguesePotawatomiPuebloPuerto RicanPuget Sound SalishRomanianRussianSalvadoranSamoanScandinavianScotch-IrishScottishSeminoleSenegaleseSerbianShoshoneSierra LeoneanSiouxSlavicSlovakSloveneSomaliSouth AfricanSouth AmericanSouth American IndianSoviet UnionSpaniardSpanishSpanish AmericanSpanish American IndianSri LankanSubsaharan AfricanSudaneseSwedishSwissSyrianTaiwaneseThaiTlingit-HaidaTohono O'OdhamTonganTrinidadian and TobagonianTsimshianTurkishU.S. Virgin IslanderUgandanUkrainianUruguayanUteVenezuelanVietnameseWelshWest IndianYakamaYaquiYugoslavianYumanYup'ikZimbabwean
Immigration
NonimmigrantsImmigrantsAfghanistanAfricaAlbaniaArgentinaArmeniaAsiaAustraliaAustriaBahamasBangladeshBarbadosBelarusBelgiumBelizeBoliviaBosnia and HerzegovinaBrazilBulgariaBurma/MyanmarCabo VerdeCambodiaCameroonCanadaCaribbeanCentral AmericaChileChinaColombiaCongoCosta RicaCroatiaCubaCzechoslovakiaDenmarkDominicaDominican RepublicEastern AfricaEastern AsiaEastern EuropeEcuadorEgyptEl SalvadorEnglandEritreaEthiopiaEuropeFijiFranceGermanyGhanaGreeceGrenadaGuatemalaGuyanaHaitiHondurasHong KongHungaryIndiaIndonesiaIranIraqIrelandIsraelItalyJamaicaJapanKazakhstanKenyaKoreaKuwaitLaosLatin AmericaLatviaLebanonLiberiaLithuaniaMalaysiaMexicoMicronesiaMiddle AfricaMoldovaMoroccoNepalNetherlandsNicaraguaNigeriaNorth AmericaNorth MacedoniaNorthern AfricaNorthern EuropeNorwayOceaniaPakistanPanamaPeruPhilippinesPolandPortugalRomaniaRussiaSaudi ArabiaScotlandSenegalSerbiaSierra LeoneSingaporeSomaliaSouth AfricaSouth AmericaSouth Central AsiaSouth Eastern AsiaSouthern EuropeSpainSri LankaSt. Vincent and the GrenadinesSudanSwedenSwitzerlandSyriaTaiwanThailandTrinidad and TobagoTurkeyUgandaUkraineUruguayUzbekistanVenezuelaVietnamWest IndiesWestern AfricaWestern AsiaWestern EuropeYemenZaireZimbabweAzores
Immigrants from Jordan
Race
Ancestry
AfghanAfricanAlaska NativeAlaskan AthabascanAlbanianAleutAlsatianAmericanApacheArabArapahoArgentineanArmenianAssyrian/Chaldean/SyriacAustralianAustrianBahamianBangladeshiBarbadianBasqueBelgianBelizeanBermudanBhutaneseBlackfeetBolivianBrazilianBritishBritish West IndianBulgarianBurmeseCajunCambodianCanadianCape VerdeanCarpatho RusynCelticCentral AmericanCentral American IndianCherokeeCheyenneChickasawChileanChineseChippewaChoctawColombianColvilleComancheCosta RicanCreeCreekCroatianCrowCubanCypriotCzechCzechoslovakianDanishDelawareDominicanDutchDutch West IndianEastern EuropeanEcuadorianEgyptianEnglishEstonianEthiopianEuropeanFijianFilipinoFinnishFrenchFrench American IndianFrench CanadianGermanGerman RussianGhanaianGreekGuamanian/ChamorroGuatemalanGuyaneseHaitianHmongHonduranHopiHoumaHungarianIcelanderIndian (Asian)IndonesianInupiatIranianIraqiIrishIroquoisIsraeliItalianJamaicanJapaneseJordanianKenyanKiowaKoreanLaotianLatvianLebaneseLiberianLithuanianLumbeeLuxembourgerMacedonianMalaysianMalteseMarshalleseMenomineeMexicanMexican American IndianMongolianMoroccanNative HawaiianNavajoNepaleseNew ZealanderNicaraguanNigerianNorthern EuropeanNorwegianOkinawanOsageOttawaPaiutePakistaniPalestinianPanamanianParaguayanPennsylvania GermanPeruvianPimaPolishPortuguesePotawatomiPuebloPuerto RicanPuget Sound SalishRomanianRussianSalvadoranSamoanScandinavianScotch-IrishScottishSeminoleSenegaleseSerbianShoshoneSierra LeoneanSiouxSlavicSlovakSloveneSomaliSouth AfricanSouth AmericanSouth American IndianSoviet UnionSpaniardSpanishSpanish AmericanSpanish American IndianSri LankanSubsaharan AfricanSudaneseSwedishSwissSyrianTaiwaneseThaiTlingit-HaidaTohono O'OdhamTonganTrinidadian and TobagonianTsimshianTurkishU.S. Virgin IslanderUgandanUruguayanUteVenezuelanVietnameseWelshWest IndianYakamaYaquiYugoslavianYumanYup'ikZimbabwean
Immigration
NonimmigrantsImmigrantsAfghanistanAfricaAlbaniaArgentinaArmeniaAsiaAustraliaAustriaBahamasBangladeshBarbadosBelarusBelgiumBelizeBoliviaBosnia and HerzegovinaBrazilBulgariaBurma/MyanmarCabo VerdeCambodiaCameroonCanadaCaribbeanCentral AmericaChileChinaColombiaCongoCosta RicaCroatiaCubaCzechoslovakiaDenmarkDominicaDominican RepublicEastern AfricaEastern AsiaEastern EuropeEcuadorEgyptEl SalvadorEnglandEritreaEthiopiaEuropeFijiFranceGermanyGhanaGreeceGrenadaGuatemalaGuyanaHaitiHondurasHong KongHungaryIndiaIndonesiaIranIraqIrelandIsraelItalyJamaicaJapanJordanKazakhstanKenyaKoreaKuwaitLaosLatin AmericaLatviaLebanonLiberiaLithuaniaMalaysiaMexicoMicronesiaMiddle AfricaMoldovaMoroccoNepalNetherlandsNicaraguaNigeriaNorth AmericaNorth MacedoniaNorthern AfricaNorthern EuropeNorwayOceaniaPakistanPanamaPeruPhilippinesPolandPortugalRomaniaRussiaSaudi ArabiaScotlandSenegalSerbiaSierra LeoneSingaporeSomaliaSouth AfricaSouth AmericaSouth Central AsiaSouth Eastern AsiaSouthern EuropeSpainSri LankaSt. Vincent and the GrenadinesSudanSwedenSwitzerlandSyriaTaiwanThailandTrinidad and TobagoTurkeyUgandaUkraineUruguayUzbekistanVenezuelaVietnamWest IndiesWestern AfricaWestern AsiaWestern EuropeYemenZaireZimbabweAzores
Disability Age Over 75
Income
Poverty
Unemployment
Labor Participation
Family Structure
Vehicle Availability
Education Level
Disability

Disability Age Over 75 Comparison

Ukrainians

Immigrants from Jordan

Exceptional
Exceptional
46.4%
DISABILITY AGE OVER 75
97.1/ 100
METRIC RATING
103rd/ 347
METRIC RANK
46.2%
DISABILITY AGE OVER 75
98.7/ 100
METRIC RATING
84th/ 347
METRIC RANK

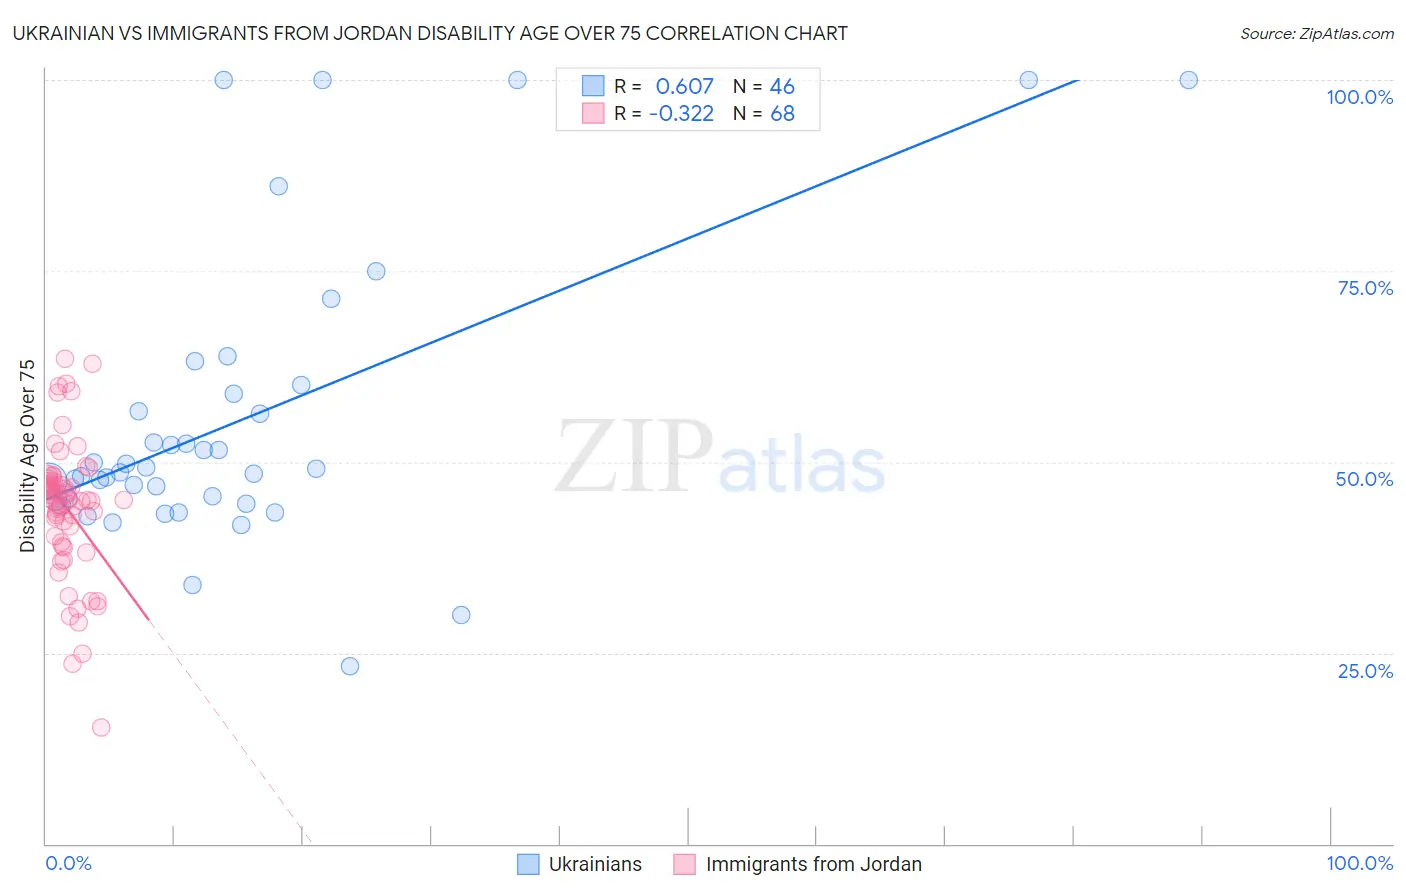
Ukrainian vs Immigrants from Jordan Disability Age Over 75 Correlation Chart

The statistical analysis conducted on geographies consisting of 447,710,922 people shows a significant positive correlation between the proportion of Ukrainians and percentage of population with a disability over the age of 75 in the United States with a correlation coefficient (R) of 0.607 and weighted average of 46.4%. Similarly, the statistical analysis conducted on geographies consisting of 181,194,306 people shows a mild negative correlation between the proportion of Immigrants from Jordan and percentage of population with a disability over the age of 75 in the United States with a correlation coefficient (R) of -0.322 and weighted average of 46.2%, a difference of 0.46%.
Ukrainian vs Immigrants from Jordan Disability Age Over 75

Disability Age Over 75 Correlation Summary

MeasurementUkrainianImmigrants from Jordan
Minimum23.2%15.2%
Maximum100.0%63.5%
Range76.8%48.4%
Mean55.4%43.9%
Median48.9%45.1%
Interquartile 25% (IQ1)45.2%39.8%
Interquartile 75% (IQ3)58.8%47.4%
Interquartile Range (IQR)13.7%7.5%
Standard Deviation (Sample)18.9%9.0%
Standard Deviation (Population)18.7%8.9%

Demographics Similar to Ukrainians and Immigrants from Jordan by Disability Age Over 75

In terms of disability age over 75, the demographic groups most similar to Ukrainians are Immigrants from Malaysia (46.4%, a difference of 0.010%), Palestinian (46.3%, a difference of 0.13%), Immigrants from Eastern Europe (46.3%, a difference of 0.13%), Mongolian (46.3%, a difference of 0.13%), and Immigrants from Japan (46.3%, a difference of 0.17%). Similarly, the demographic groups most similar to Immigrants from Jordan are Argentinean (46.2%, a difference of 0.010%), Immigrants from Southern Europe (46.2%, a difference of 0.020%), Romanian (46.2%, a difference of 0.020%), Danish (46.2%, a difference of 0.020%), and Uruguayan (46.2%, a difference of 0.11%).
DemographicsRating | RankDisability Age Over 75
Argentineans
98.7
/100
|
#83
Exceptional
46.2%
Immigrants | Jordan
98.7
/100
|
#84
Exceptional
46.2%
Immigrants | Southern Europe
98.6
/100
|
#85
Exceptional
46.2%
Romanians
98.6
/100
|
#86
Exceptional
46.2%
Danes
98.6
/100
|
#87
Exceptional
46.2%
Uruguayans
98.4
/100
|
#88
Exceptional
46.2%
Immigrants | Saudi Arabia
98.4
/100
|
#89
Exceptional
46.3%
Northern Europeans
98.3
/100
|
#90
Exceptional
46.3%
Immigrants | Egypt
98.3
/100
|
#91
Exceptional
46.3%
Germans
98.2
/100
|
#92
Exceptional
46.3%
Ugandans
98.2
/100
|
#93
Exceptional
46.3%
Albanians
98.1
/100
|
#94
Exceptional
46.3%
Immigrants | Brazil
98.0
/100
|
#95
Exceptional
46.3%
Immigrants | China
98.0
/100
|
#96
Exceptional
46.3%
Finns
97.9
/100
|
#97
Exceptional
46.3%
Immigrants | Japan
97.8
/100
|
#98
Exceptional
46.3%
Palestinians
97.7
/100
|
#99
Exceptional
46.3%
Immigrants | Eastern Europe
97.7
/100
|
#100
Exceptional
46.3%
Mongolians
97.7
/100
|
#101
Exceptional
46.3%
Immigrants | Malaysia
97.1
/100
|
#102
Exceptional
46.4%
Ukrainians
97.1
/100
|
#103
Exceptional
46.4%