Ukrainian vs Liberian Disability Age Over 75
COMPARE
Ukrainian
Liberian
Disability Age Over 75
Disability Age Over 75 Comparison
Ukrainians
Liberians
46.4%
DISABILITY AGE OVER 75
97.1/ 100
METRIC RATING
103rd/ 347
METRIC RANK
48.0%
DISABILITY AGE OVER 75
6.7/ 100
METRIC RATING
224th/ 347
METRIC RANK
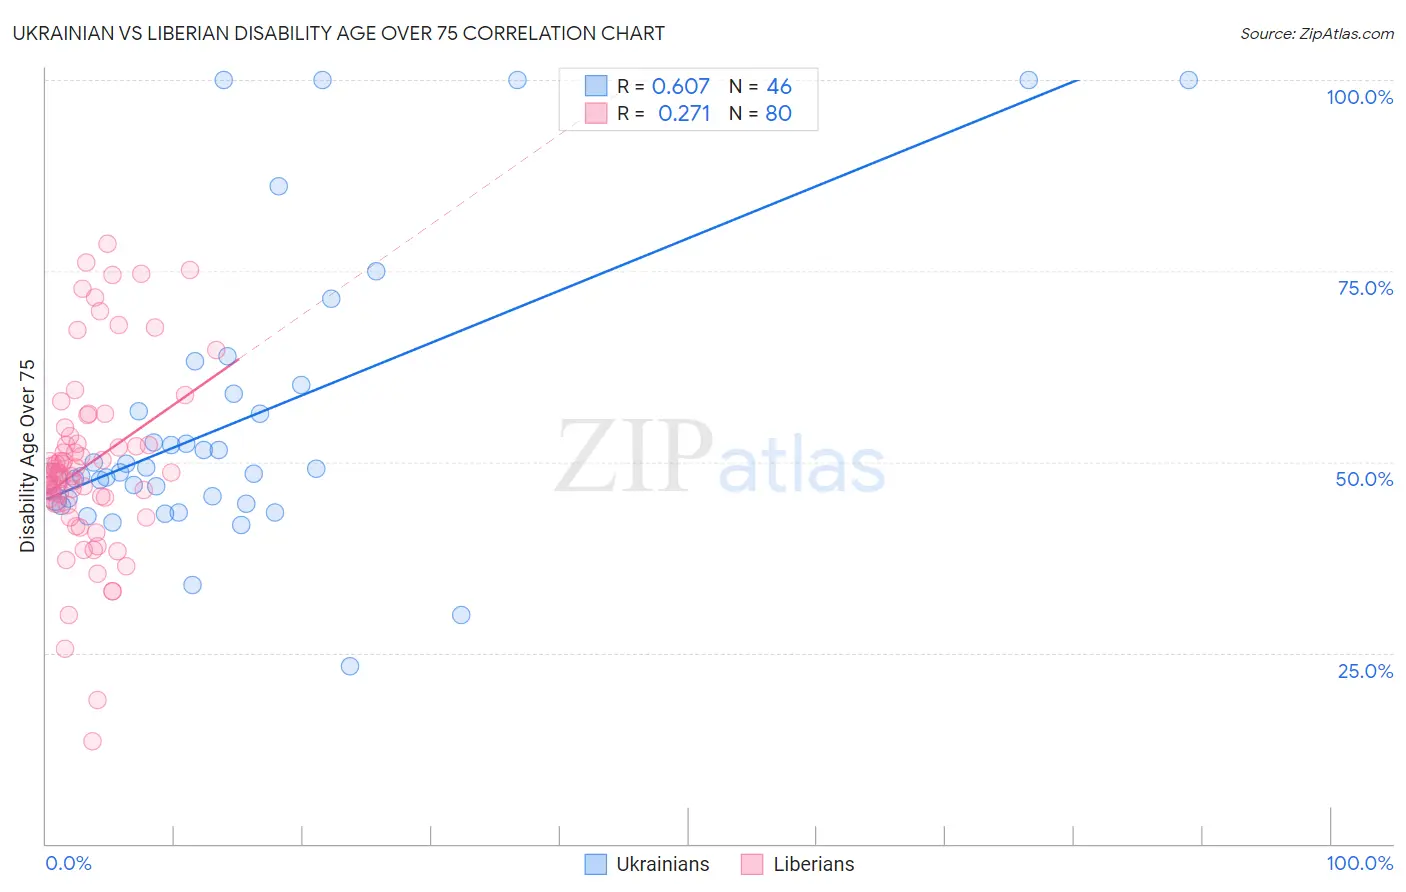
Ukrainian vs Liberian Disability Age Over 75 Correlation Chart
The statistical analysis conducted on geographies consisting of 447,710,922 people shows a significant positive correlation between the proportion of Ukrainians and percentage of population with a disability over the age of 75 in the United States with a correlation coefficient (R) of 0.607 and weighted average of 46.4%. Similarly, the statistical analysis conducted on geographies consisting of 117,925,448 people shows a weak positive correlation between the proportion of Liberians and percentage of population with a disability over the age of 75 in the United States with a correlation coefficient (R) of 0.271 and weighted average of 48.0%, a difference of 3.5%.
Disability Age Over 75 Correlation Summary
| Measurement | Ukrainian | Liberian |
| Minimum | 23.2% | 13.3% |
| Maximum | 100.0% | 78.6% |
| Range | 76.8% | 65.3% |
| Mean | 55.4% | 49.6% |
| Median | 48.9% | 48.5% |
| Interquartile 25% (IQ1) | 45.2% | 44.5% |
| Interquartile 75% (IQ3) | 58.8% | 52.9% |
| Interquartile Range (IQR) | 13.7% | 8.3% |
| Standard Deviation (Sample) | 18.9% | 12.3% |
| Standard Deviation (Population) | 18.7% | 12.2% |
Similar Demographics by Disability Age Over 75
Demographics Similar to Ukrainians by Disability Age Over 75
In terms of disability age over 75, the demographic groups most similar to Ukrainians are Immigrants from Malaysia (46.4%, a difference of 0.010%), Israeli (46.4%, a difference of 0.020%), Immigrants from Cameroon (46.4%, a difference of 0.040%), Immigrants from Kuwait (46.4%, a difference of 0.050%), and Immigrants from Uruguay (46.4%, a difference of 0.090%).
| Demographics | Rating | Rank | Disability Age Over 75 |
| Immigrants | China | 98.0 /100 | #96 | Exceptional 46.3% |
| Finns | 97.9 /100 | #97 | Exceptional 46.3% |
| Immigrants | Japan | 97.8 /100 | #98 | Exceptional 46.3% |
| Palestinians | 97.7 /100 | #99 | Exceptional 46.3% |
| Immigrants | Eastern Europe | 97.7 /100 | #100 | Exceptional 46.3% |
| Mongolians | 97.7 /100 | #101 | Exceptional 46.3% |
| Immigrants | Malaysia | 97.1 /100 | #102 | Exceptional 46.4% |
| Ukrainians | 97.1 /100 | #103 | Exceptional 46.4% |
| Israelis | 97.0 /100 | #104 | Exceptional 46.4% |
| Immigrants | Cameroon | 96.9 /100 | #105 | Exceptional 46.4% |
| Immigrants | Kuwait | 96.8 /100 | #106 | Exceptional 46.4% |
| Immigrants | Uruguay | 96.7 /100 | #107 | Exceptional 46.4% |
| Brazilians | 96.6 /100 | #108 | Exceptional 46.5% |
| Chileans | 96.4 /100 | #109 | Exceptional 46.5% |
| Immigrants | Hong Kong | 96.4 /100 | #110 | Exceptional 46.5% |
Demographics Similar to Liberians by Disability Age Over 75
In terms of disability age over 75, the demographic groups most similar to Liberians are Barbadian (48.0%, a difference of 0.010%), Immigrants from Bangladesh (48.0%, a difference of 0.010%), Spanish (48.0%, a difference of 0.010%), Nonimmigrants (48.0%, a difference of 0.020%), and Zimbabwean (48.1%, a difference of 0.020%).
| Demographics | Rating | Rank | Disability Age Over 75 |
| Immigrants | Grenada | 9.4 /100 | #217 | Tragic 47.9% |
| Immigrants | Western Africa | 8.3 /100 | #218 | Tragic 48.0% |
| Immigrants | Western Asia | 7.5 /100 | #219 | Tragic 48.0% |
| Bahamians | 7.4 /100 | #220 | Tragic 48.0% |
| Immigrants | Oceania | 7.3 /100 | #221 | Tragic 48.0% |
| Barbadians | 6.8 /100 | #222 | Tragic 48.0% |
| Immigrants | Bangladesh | 6.8 /100 | #223 | Tragic 48.0% |
| Liberians | 6.7 /100 | #224 | Tragic 48.0% |
| Spanish | 6.5 /100 | #225 | Tragic 48.0% |
| Immigrants | Nonimmigrants | 6.5 /100 | #226 | Tragic 48.0% |
| Zimbabweans | 6.4 /100 | #227 | Tragic 48.1% |
| Immigrants | Liberia | 5.9 /100 | #228 | Tragic 48.1% |
| Spaniards | 5.7 /100 | #229 | Tragic 48.1% |
| Taiwanese | 4.4 /100 | #230 | Tragic 48.2% |
| Immigrants | Immigrants | 4.3 /100 | #231 | Tragic 48.2% |