Turkish vs Immigrants from Poland Unemployment Among Youth under 25 years
COMPARE
Turkish
Immigrants from Poland
Unemployment Among Youth under 25 years
Unemployment Among Youth under 25 years Comparison
Turks
Immigrants from Poland
11.4%
UNEMPLOYMENT AMONG YOUTH UNDER 25 YEARS
85.8/ 100
METRIC RATING
129th/ 347
METRIC RANK
11.7%
UNEMPLOYMENT AMONG YOUTH UNDER 25 YEARS
31.4/ 100
METRIC RATING
188th/ 347
METRIC RANK
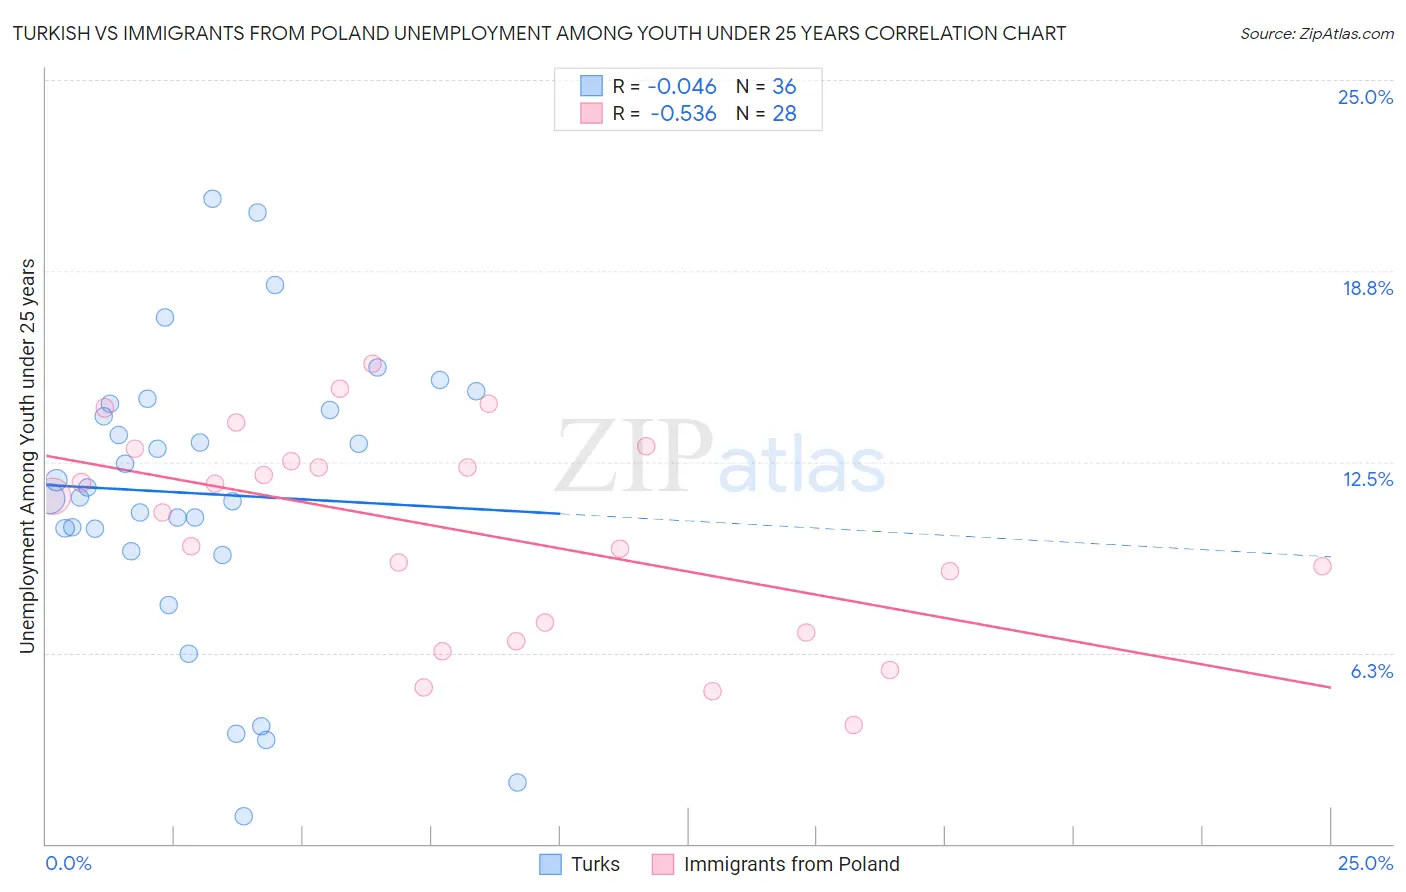
Turkish vs Immigrants from Poland Unemployment Among Youth under 25 years Correlation Chart
The statistical analysis conducted on geographies consisting of 269,922,235 people shows no correlation between the proportion of Turks and unemployment rate among youth under the age of 25 in the United States with a correlation coefficient (R) of -0.046 and weighted average of 11.4%. Similarly, the statistical analysis conducted on geographies consisting of 301,711,509 people shows a substantial negative correlation between the proportion of Immigrants from Poland and unemployment rate among youth under the age of 25 in the United States with a correlation coefficient (R) of -0.536 and weighted average of 11.7%, a difference of 2.7%.
Unemployment Among Youth under 25 years Correlation Summary
| Measurement | Turkish | Immigrants from Poland |
| Minimum | 0.90% | 3.9% |
| Maximum | 21.1% | 15.7% |
| Range | 20.2% | 11.8% |
| Mean | 11.5% | 10.3% |
| Median | 11.5% | 11.1% |
| Interquartile 25% (IQ1) | 9.9% | 7.1% |
| Interquartile 75% (IQ3) | 14.3% | 12.7% |
| Interquartile Range (IQR) | 4.4% | 5.6% |
| Standard Deviation (Sample) | 4.7% | 3.4% |
| Standard Deviation (Population) | 4.7% | 3.3% |
Similar Demographics by Unemployment Among Youth under 25 years
Demographics Similar to Turks by Unemployment Among Youth under 25 years
In terms of unemployment among youth under 25 years, the demographic groups most similar to Turks are Hungarian (11.4%, a difference of 0.010%), Immigrants from Hungary (11.4%, a difference of 0.020%), Greek (11.4%, a difference of 0.030%), Canadian (11.4%, a difference of 0.070%), and Immigrants from Spain (11.4%, a difference of 0.10%).
| Demographics | Rating | Rank | Unemployment Among Youth under 25 years |
| Immigrants | Micronesia | 88.1 /100 | #122 | Excellent 11.4% |
| Basques | 87.8 /100 | #123 | Excellent 11.4% |
| Italians | 87.2 /100 | #124 | Excellent 11.4% |
| Immigrants | Argentina | 87.2 /100 | #125 | Excellent 11.4% |
| Canadians | 86.6 /100 | #126 | Excellent 11.4% |
| Greeks | 86.2 /100 | #127 | Excellent 11.4% |
| Immigrants | Hungary | 86.0 /100 | #128 | Excellent 11.4% |
| Turks | 85.8 /100 | #129 | Excellent 11.4% |
| Hungarians | 85.7 /100 | #130 | Excellent 11.4% |
| Immigrants | Spain | 84.6 /100 | #131 | Excellent 11.4% |
| Ethiopians | 83.2 /100 | #132 | Excellent 11.4% |
| Lebanese | 83.1 /100 | #133 | Excellent 11.4% |
| Immigrants | Chile | 80.4 /100 | #134 | Excellent 11.4% |
| Immigrants | Oceania | 80.2 /100 | #135 | Excellent 11.4% |
| Romanians | 80.1 /100 | #136 | Excellent 11.4% |
Demographics Similar to Immigrants from Poland by Unemployment Among Youth under 25 years
In terms of unemployment among youth under 25 years, the demographic groups most similar to Immigrants from Poland are Immigrants from Egypt (11.7%, a difference of 0.030%), Japanese (11.7%, a difference of 0.030%), Portuguese (11.7%, a difference of 0.050%), French American Indian (11.7%, a difference of 0.12%), and Maltese (11.7%, a difference of 0.12%).
| Demographics | Rating | Rank | Unemployment Among Youth under 25 years |
| Syrians | 38.4 /100 | #181 | Fair 11.7% |
| Immigrants | Italy | 36.2 /100 | #182 | Fair 11.7% |
| Americans | 34.5 /100 | #183 | Fair 11.7% |
| Immigrants | Eastern Europe | 34.1 /100 | #184 | Fair 11.7% |
| French American Indians | 34.0 /100 | #185 | Fair 11.7% |
| Maltese | 33.9 /100 | #186 | Fair 11.7% |
| Immigrants | Egypt | 31.9 /100 | #187 | Fair 11.7% |
| Immigrants | Poland | 31.4 /100 | #188 | Fair 11.7% |
| Japanese | 30.8 /100 | #189 | Fair 11.7% |
| Portuguese | 30.3 /100 | #190 | Fair 11.7% |
| Cypriots | 28.5 /100 | #191 | Fair 11.7% |
| Immigrants | Russia | 28.5 /100 | #192 | Fair 11.7% |
| Seminole | 27.9 /100 | #193 | Fair 11.7% |
| Immigrants | Sri Lanka | 27.8 /100 | #194 | Fair 11.7% |
| Paraguayans | 27.2 /100 | #195 | Fair 11.7% |