Immigrants from Israel vs Sierra Leonean Disability Age Under 5
COMPARE
Immigrants from Israel
Sierra Leonean
Disability Age Under 5
Disability Age Under 5 Comparison
Immigrants from Israel
Sierra Leoneans
0.96%
DISABILITY AGE UNDER 5
100.0/ 100
METRIC RATING
16th/ 347
METRIC RANK
1.2%
DISABILITY AGE UNDER 5
59.1/ 100
METRIC RATING
168th/ 347
METRIC RANK
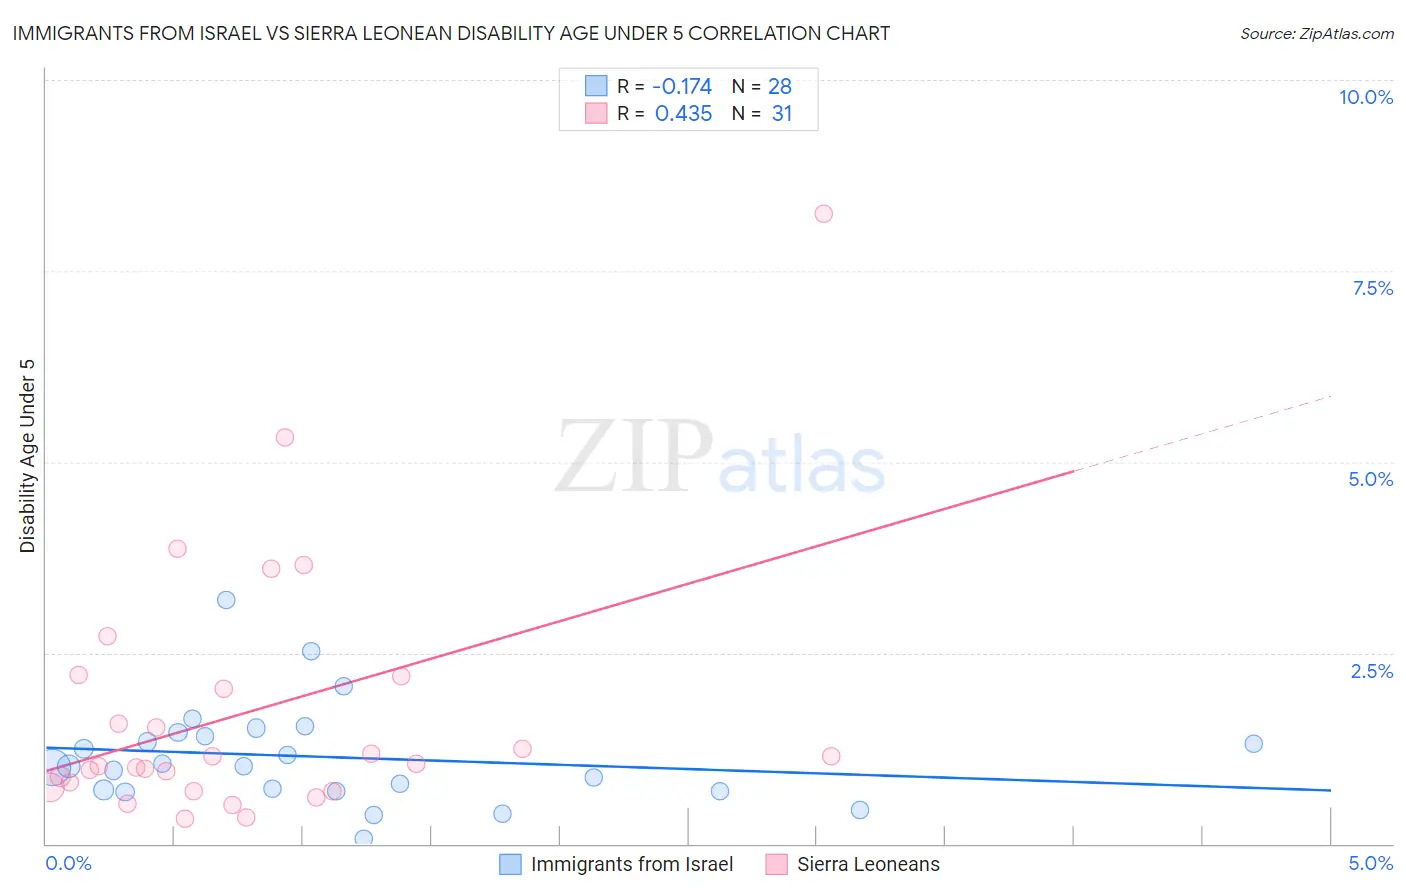
Immigrants from Israel vs Sierra Leonean Disability Age Under 5 Correlation Chart
The statistical analysis conducted on geographies consisting of 133,347,398 people shows a poor negative correlation between the proportion of Immigrants from Israel and percentage of population with a disability under the age of 5 in the United States with a correlation coefficient (R) of -0.174 and weighted average of 0.96%. Similarly, the statistical analysis conducted on geographies consisting of 65,429,167 people shows a moderate positive correlation between the proportion of Sierra Leoneans and percentage of population with a disability under the age of 5 in the United States with a correlation coefficient (R) of 0.435 and weighted average of 1.2%, a difference of 28.2%.
Disability Age Under 5 Correlation Summary
| Measurement | Immigrants from Israel | Sierra Leonean |
| Minimum | 0.058% | 0.32% |
| Maximum | 3.2% | 8.2% |
| Range | 3.1% | 7.9% |
| Mean | 1.1% | 1.7% |
| Median | 1.0% | 1.0% |
| Interquartile 25% (IQ1) | 0.70% | 0.74% |
| Interquartile 75% (IQ3) | 1.4% | 2.2% |
| Interquartile Range (IQR) | 0.74% | 1.5% |
| Standard Deviation (Sample) | 0.66% | 1.7% |
| Standard Deviation (Population) | 0.65% | 1.7% |
Similar Demographics by Disability Age Under 5
Demographics Similar to Immigrants from Israel by Disability Age Under 5
In terms of disability age under 5, the demographic groups most similar to Immigrants from Israel are Immigrants from China (0.96%, a difference of 0.41%), Immigrants from Barbados (0.97%, a difference of 1.0%), Immigrants from Hong Kong (0.95%, a difference of 1.3%), Yuman (0.95%, a difference of 1.3%), and Puget Sound Salish (0.97%, a difference of 1.4%).
| Demographics | Rating | Rank | Disability Age Under 5 |
| Immigrants | Fiji | 100.0 /100 | #9 | Exceptional 0.92% |
| Marshallese | 100.0 /100 | #10 | Exceptional 0.94% |
| Afghans | 100.0 /100 | #11 | Exceptional 0.94% |
| Immigrants | Grenada | 100.0 /100 | #12 | Exceptional 0.94% |
| Soviet Union | 100.0 /100 | #13 | Exceptional 0.95% |
| Yuman | 100.0 /100 | #14 | Exceptional 0.95% |
| Immigrants | Hong Kong | 100.0 /100 | #15 | Exceptional 0.95% |
| Immigrants | Israel | 100.0 /100 | #16 | Exceptional 0.96% |
| Immigrants | China | 100.0 /100 | #17 | Exceptional 0.96% |
| Immigrants | Barbados | 100.0 /100 | #18 | Exceptional 0.97% |
| Puget Sound Salish | 100.0 /100 | #19 | Exceptional 0.97% |
| Nepalese | 100.0 /100 | #20 | Exceptional 0.97% |
| British West Indians | 100.0 /100 | #21 | Exceptional 0.99% |
| Immigrants | Iran | 100.0 /100 | #22 | Exceptional 1.00% |
| Yakama | 100.0 /100 | #23 | Exceptional 1.00% |
Demographics Similar to Sierra Leoneans by Disability Age Under 5
In terms of disability age under 5, the demographic groups most similar to Sierra Leoneans are Immigrants from Uruguay (1.2%, a difference of 0.010%), Immigrants from Jamaica (1.2%, a difference of 0.030%), Immigrants from Argentina (1.2%, a difference of 0.11%), Guamanian/Chamorro (1.2%, a difference of 0.12%), and Immigrants from Central America (1.2%, a difference of 0.22%).
| Demographics | Rating | Rank | Disability Age Under 5 |
| Immigrants | Africa | 65.1 /100 | #161 | Good 1.2% |
| Guatemalans | 63.6 /100 | #162 | Good 1.2% |
| Immigrants | Guatemala | 63.2 /100 | #163 | Good 1.2% |
| Laotians | 62.8 /100 | #164 | Good 1.2% |
| Immigrants | Kuwait | 62.6 /100 | #165 | Good 1.2% |
| Immigrants | Central America | 61.4 /100 | #166 | Good 1.2% |
| Immigrants | Argentina | 60.2 /100 | #167 | Good 1.2% |
| Sierra Leoneans | 59.1 /100 | #168 | Average 1.2% |
| Immigrants | Uruguay | 59.0 /100 | #169 | Average 1.2% |
| Immigrants | Jamaica | 58.8 /100 | #170 | Average 1.2% |
| Guamanians/Chamorros | 57.8 /100 | #171 | Average 1.2% |
| Crow | 51.0 /100 | #172 | Average 1.2% |
| Immigrants | Ireland | 50.3 /100 | #173 | Average 1.2% |
| Immigrants | Latvia | 50.0 /100 | #174 | Average 1.2% |
| Immigrants | Nigeria | 50.0 /100 | #175 | Average 1.2% |