Tohono O'odham vs Soviet Union Kindergarten
COMPARE
Tohono O'odham
Soviet Union
Kindergarten
Kindergarten Comparison
Tohono O'odham
Soviet Union
97.9%
KINDERGARTEN
24.6/ 100
METRIC RATING
198th/ 347
METRIC RANK
98.0%
KINDERGARTEN
70.8/ 100
METRIC RATING
151st/ 347
METRIC RANK
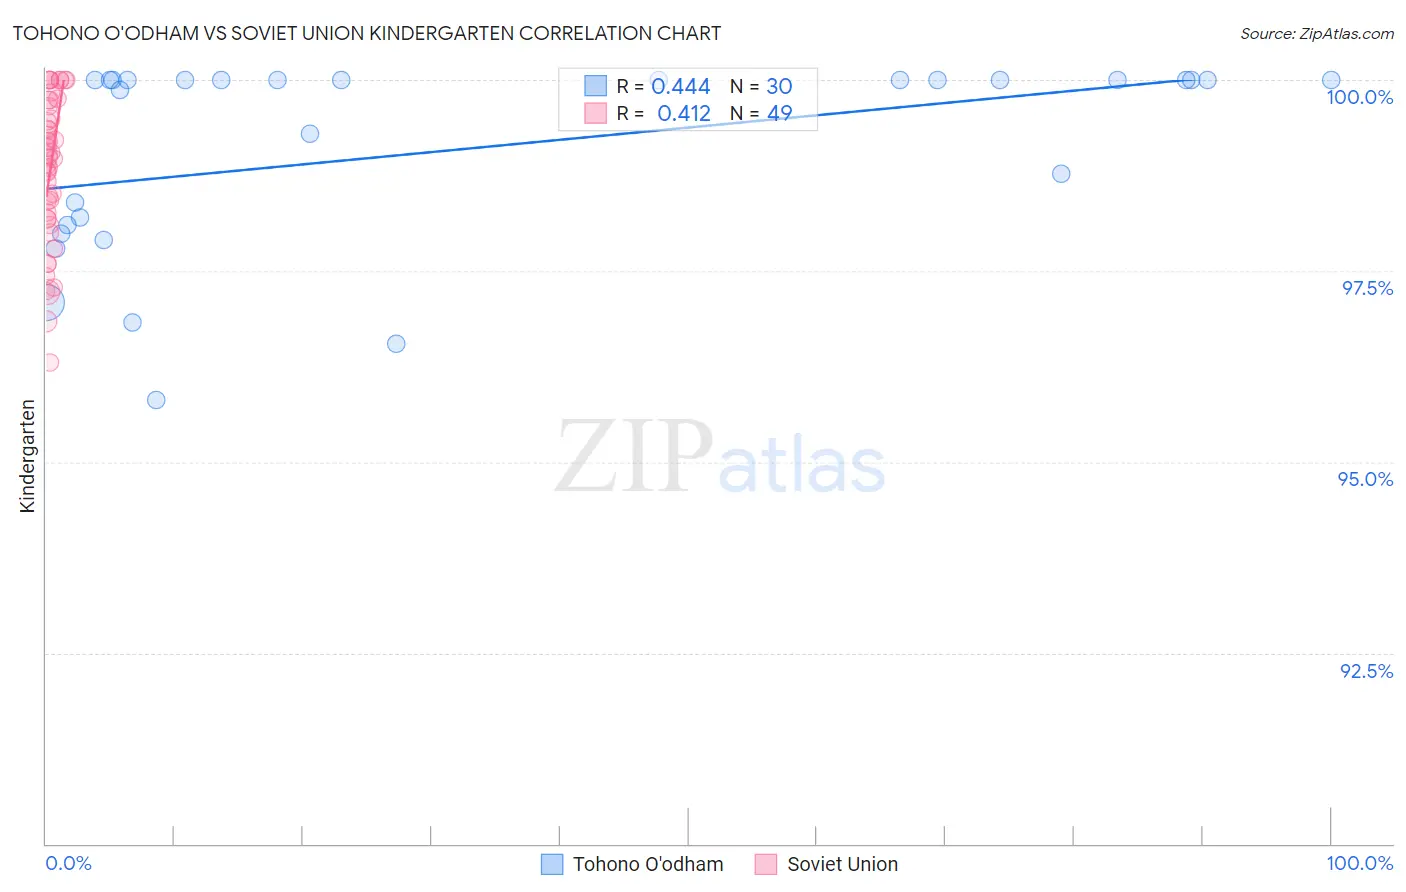
Tohono O'odham vs Soviet Union Kindergarten Correlation Chart
The statistical analysis conducted on geographies consisting of 58,723,100 people shows a moderate positive correlation between the proportion of Tohono O'odham and percentage of population with at least kindergarten education in the United States with a correlation coefficient (R) of 0.444 and weighted average of 97.9%. Similarly, the statistical analysis conducted on geographies consisting of 43,454,395 people shows a moderate positive correlation between the proportion of Soviet Union and percentage of population with at least kindergarten education in the United States with a correlation coefficient (R) of 0.412 and weighted average of 98.0%, a difference of 0.15%.
Kindergarten Correlation Summary
| Measurement | Tohono O'odham | Soviet Union |
| Minimum | 95.8% | 96.3% |
| Maximum | 100.0% | 100.0% |
| Range | 4.2% | 3.7% |
| Mean | 99.1% | 98.8% |
| Median | 100.0% | 99.0% |
| Interquartile 25% (IQ1) | 98.1% | 98.2% |
| Interquartile 75% (IQ3) | 100.0% | 99.7% |
| Interquartile Range (IQR) | 1.9% | 1.5% |
| Standard Deviation (Sample) | 1.3% | 0.96% |
| Standard Deviation (Population) | 1.3% | 0.95% |
Similar Demographics by Kindergarten
Demographics Similar to Tohono O'odham by Kindergarten
In terms of kindergarten, the demographic groups most similar to Tohono O'odham are Immigrants from Kenya (97.9%, a difference of 0.0%), Guamanian/Chamorro (97.9%, a difference of 0.010%), Immigrants from Egypt (97.9%, a difference of 0.010%), Yuman (97.9%, a difference of 0.010%), and Immigrants from Taiwan (97.9%, a difference of 0.020%).
| Demographics | Rating | Rank | Kindergarten |
| Immigrants | Taiwan | 30.7 /100 | #191 | Fair 97.9% |
| Blacks/African Americans | 29.9 /100 | #192 | Fair 97.9% |
| Paraguayans | 29.6 /100 | #193 | Fair 97.9% |
| Hawaiians | 29.3 /100 | #194 | Fair 97.9% |
| Mongolians | 28.9 /100 | #195 | Fair 97.9% |
| Guamanians/Chamorros | 26.2 /100 | #196 | Fair 97.9% |
| Immigrants | Kenya | 25.5 /100 | #197 | Fair 97.9% |
| Tohono O'odham | 24.6 /100 | #198 | Fair 97.9% |
| Immigrants | Egypt | 22.3 /100 | #199 | Fair 97.9% |
| Yuman | 21.6 /100 | #200 | Fair 97.9% |
| Immigrants | Lebanon | 20.9 /100 | #201 | Fair 97.9% |
| Immigrants | Ukraine | 19.1 /100 | #202 | Poor 97.8% |
| Immigrants | Uganda | 18.8 /100 | #203 | Poor 97.8% |
| Immigrants | Chile | 18.1 /100 | #204 | Poor 97.8% |
| Immigrants | Southern Europe | 18.0 /100 | #205 | Poor 97.8% |
Demographics Similar to Soviet Union by Kindergarten
In terms of kindergarten, the demographic groups most similar to Soviet Union are Dutch West Indian (98.0%, a difference of 0.0%), Jordanian (98.0%, a difference of 0.010%), Immigrants from Moldova (98.0%, a difference of 0.010%), Immigrants from Iran (98.0%, a difference of 0.010%), and Comanche (98.0%, a difference of 0.010%).
| Demographics | Rating | Rank | Kindergarten |
| Alsatians | 80.4 /100 | #144 | Excellent 98.1% |
| Hmong | 78.8 /100 | #145 | Good 98.1% |
| Filipinos | 78.3 /100 | #146 | Good 98.0% |
| Immigrants | Israel | 77.6 /100 | #147 | Good 98.0% |
| Apache | 75.0 /100 | #148 | Good 98.0% |
| Immigrants | Greece | 74.9 /100 | #149 | Good 98.0% |
| Jordanians | 72.8 /100 | #150 | Good 98.0% |
| Soviet Union | 70.8 /100 | #151 | Good 98.0% |
| Dutch West Indians | 70.1 /100 | #152 | Good 98.0% |
| Immigrants | Moldova | 69.1 /100 | #153 | Good 98.0% |
| Immigrants | Iran | 68.8 /100 | #154 | Good 98.0% |
| Comanche | 68.3 /100 | #155 | Good 98.0% |
| Immigrants | South Central Asia | 66.6 /100 | #156 | Good 98.0% |
| Immigrants | North Macedonia | 66.4 /100 | #157 | Good 98.0% |
| Venezuelans | 64.7 /100 | #158 | Good 98.0% |