Central American vs Soviet Union Disability Age 18 to 34

COMPARE

Central American
Race
Ancestry
AfghanAfricanAlaska NativeAlaskan AthabascanAlbanianAleutAlsatianAmericanApacheArabArapahoArgentineanArmenianAssyrian/Chaldean/SyriacAustralianAustrianBahamianBangladeshiBarbadianBasqueBelgianBelizeanBermudanBhutaneseBlackfeetBolivianBrazilianBritishBritish West IndianBulgarianBurmeseCajunCambodianCanadianCape VerdeanCarpatho RusynCelticCentral AmericanCentral American IndianCherokeeCheyenneChickasawChileanChineseChippewaChoctawColombianColvilleComancheCosta RicanCreeCreekCroatianCrowCubanCypriotCzechCzechoslovakianDanishDelawareDominicanDutchDutch West IndianEastern EuropeanEcuadorianEgyptianEnglishEstonianEthiopianEuropeanFijianFilipinoFinnishFrenchFrench American IndianFrench CanadianGermanGerman RussianGhanaianGreekGuamanian/ChamorroGuatemalanGuyaneseHaitianHmongHonduranHopiHoumaHungarianIcelanderIndian (Asian)IndonesianInupiatIranianIraqiIrishIroquoisIsraeliItalianJamaicanJapaneseJordanianKenyanKiowaKoreanLaotianLatvianLebaneseLiberianLithuanianLumbeeLuxembourgerMacedonianMalaysianMalteseMarshalleseMenomineeMexicanMexican American IndianMongolianMoroccanNative HawaiianNavajoNepaleseNew ZealanderNicaraguanNigerianNorthern EuropeanNorwegianOkinawanOsageOttawaPaiutePakistaniPalestinianPanamanianParaguayanPennsylvania GermanPeruvianPimaPolishPortuguesePotawatomiPuebloPuerto RicanPuget Sound SalishRomanianRussianSalvadoranSamoanScandinavianScotch-IrishScottishSeminoleSenegaleseSerbianShoshoneSierra LeoneanSiouxSlavicSlovakSloveneSomaliSouth AfricanSouth AmericanSouth American IndianSpaniardSpanishSpanish AmericanSpanish American IndianSri LankanSubsaharan AfricanSudaneseSwedishSwissSyrianTaiwaneseThaiTlingit-HaidaTohono O'OdhamTonganTrinidadian and TobagonianTsimshianTurkishU.S. Virgin IslanderUgandanUkrainianUruguayanUteVenezuelanVietnameseWelshWest IndianYakamaYaquiYugoslavianYumanYup'ikZimbabwean
Immigration
NonimmigrantsImmigrantsAfghanistanAfricaAlbaniaArgentinaArmeniaAsiaAustraliaAustriaBahamasBangladeshBarbadosBelarusBelgiumBelizeBoliviaBosnia and HerzegovinaBrazilBulgariaBurma/MyanmarCabo VerdeCambodiaCameroonCanadaCaribbeanCentral AmericaChileChinaColombiaCongoCosta RicaCroatiaCubaCzechoslovakiaDenmarkDominicaDominican RepublicEastern AfricaEastern AsiaEastern EuropeEcuadorEgyptEl SalvadorEnglandEritreaEthiopiaEuropeFijiFranceGermanyGhanaGreeceGrenadaGuatemalaGuyanaHaitiHondurasHong KongHungaryIndiaIndonesiaIranIraqIrelandIsraelItalyJamaicaJapanJordanKazakhstanKenyaKoreaKuwaitLaosLatin AmericaLatviaLebanonLiberiaLithuaniaMalaysiaMexicoMicronesiaMiddle AfricaMoldovaMoroccoNepalNetherlandsNicaraguaNigeriaNorth AmericaNorth MacedoniaNorthern AfricaNorthern EuropeNorwayOceaniaPakistanPanamaPeruPhilippinesPolandPortugalRomaniaRussiaSaudi ArabiaScotlandSenegalSerbiaSierra LeoneSingaporeSomaliaSouth AfricaSouth AmericaSouth Central AsiaSouth Eastern AsiaSouthern EuropeSpainSri LankaSt. Vincent and the GrenadinesSudanSwedenSwitzerlandSyriaTaiwanThailandTrinidad and TobagoTurkeyUgandaUkraineUruguayUzbekistanVenezuelaVietnamWest IndiesWestern AfricaWestern AsiaWestern EuropeYemenZaireZimbabweAzores
Soviet Union
Race
Ancestry
AfghanAfricanAlaska NativeAlaskan AthabascanAlbanianAleutAlsatianAmericanApacheArabArapahoArgentineanArmenianAssyrian/Chaldean/SyriacAustralianAustrianBahamianBangladeshiBarbadianBasqueBelgianBelizeanBermudanBhutaneseBlackfeetBolivianBrazilianBritishBritish West IndianBulgarianBurmeseCajunCambodianCanadianCape VerdeanCarpatho RusynCelticCentral American IndianCherokeeCheyenneChickasawChileanChineseChippewaChoctawColombianColvilleComancheCosta RicanCreeCreekCroatianCrowCubanCypriotCzechCzechoslovakianDanishDelawareDominicanDutchDutch West IndianEastern EuropeanEcuadorianEgyptianEnglishEstonianEthiopianEuropeanFijianFilipinoFinnishFrenchFrench American IndianFrench CanadianGermanGerman RussianGhanaianGreekGuamanian/ChamorroGuatemalanGuyaneseHaitianHmongHonduranHopiHoumaHungarianIcelanderIndian (Asian)IndonesianInupiatIranianIraqiIrishIroquoisIsraeliItalianJamaicanJapaneseJordanianKenyanKiowaKoreanLaotianLatvianLebaneseLiberianLithuanianLumbeeLuxembourgerMacedonianMalaysianMalteseMarshalleseMenomineeMexicanMexican American IndianMongolianMoroccanNative HawaiianNavajoNepaleseNew ZealanderNicaraguanNigerianNorthern EuropeanNorwegianOkinawanOsageOttawaPaiutePakistaniPalestinianPanamanianParaguayanPennsylvania GermanPeruvianPimaPolishPortuguesePotawatomiPuebloPuerto RicanPuget Sound SalishRomanianRussianSalvadoranSamoanScandinavianScotch-IrishScottishSeminoleSenegaleseSerbianShoshoneSierra LeoneanSiouxSlavicSlovakSloveneSomaliSouth AfricanSouth AmericanSouth American IndianSoviet UnionSpaniardSpanishSpanish AmericanSpanish American IndianSri LankanSubsaharan AfricanSudaneseSwedishSwissSyrianTaiwaneseThaiTlingit-HaidaTohono O'OdhamTonganTrinidadian and TobagonianTsimshianTurkishU.S. Virgin IslanderUgandanUkrainianUruguayanUteVenezuelanVietnameseWelshWest IndianYakamaYaquiYugoslavianYumanYup'ikZimbabwean
Immigration
NonimmigrantsImmigrantsAfghanistanAfricaAlbaniaArgentinaArmeniaAsiaAustraliaAustriaBahamasBangladeshBarbadosBelarusBelgiumBelizeBoliviaBosnia and HerzegovinaBrazilBulgariaBurma/MyanmarCabo VerdeCambodiaCameroonCanadaCaribbeanCentral AmericaChileChinaColombiaCongoCosta RicaCroatiaCubaCzechoslovakiaDenmarkDominicaDominican RepublicEastern AfricaEastern AsiaEastern EuropeEcuadorEgyptEl SalvadorEnglandEritreaEthiopiaEuropeFijiFranceGermanyGhanaGreeceGrenadaGuatemalaGuyanaHaitiHondurasHong KongHungaryIndiaIndonesiaIranIraqIrelandIsraelItalyJamaicaJapanJordanKazakhstanKenyaKoreaKuwaitLaosLatin AmericaLatviaLebanonLiberiaLithuaniaMalaysiaMexicoMicronesiaMiddle AfricaMoldovaMoroccoNepalNetherlandsNicaraguaNigeriaNorth AmericaNorth MacedoniaNorthern AfricaNorthern EuropeNorwayOceaniaPakistanPanamaPeruPhilippinesPolandPortugalRomaniaRussiaSaudi ArabiaScotlandSenegalSerbiaSierra LeoneSingaporeSomaliaSouth AfricaSouth AmericaSouth Central AsiaSouth Eastern AsiaSouthern EuropeSpainSri LankaSt. Vincent and the GrenadinesSudanSwedenSwitzerlandSyriaTaiwanThailandTrinidad and TobagoTurkeyUgandaUkraineUruguayUzbekistanVenezuelaVietnamWest IndiesWestern AfricaWestern AsiaWestern EuropeYemenZaireZimbabweAzores
Disability Age 18 to 34
Income
Poverty
Unemployment
Labor Participation
Family Structure
Vehicle Availability
Education Level
Disability

Disability Age 18 to 34 Comparison

Central Americans

Soviet Union

Exceptional
Exceptional
6.2%
DISABILITY AGE 18 TO 34
97.5/ 100
METRIC RATING
95th/ 347
METRIC RANK
5.7%
DISABILITY AGE 18 TO 34
99.9/ 100
METRIC RATING
28th/ 347
METRIC RANK

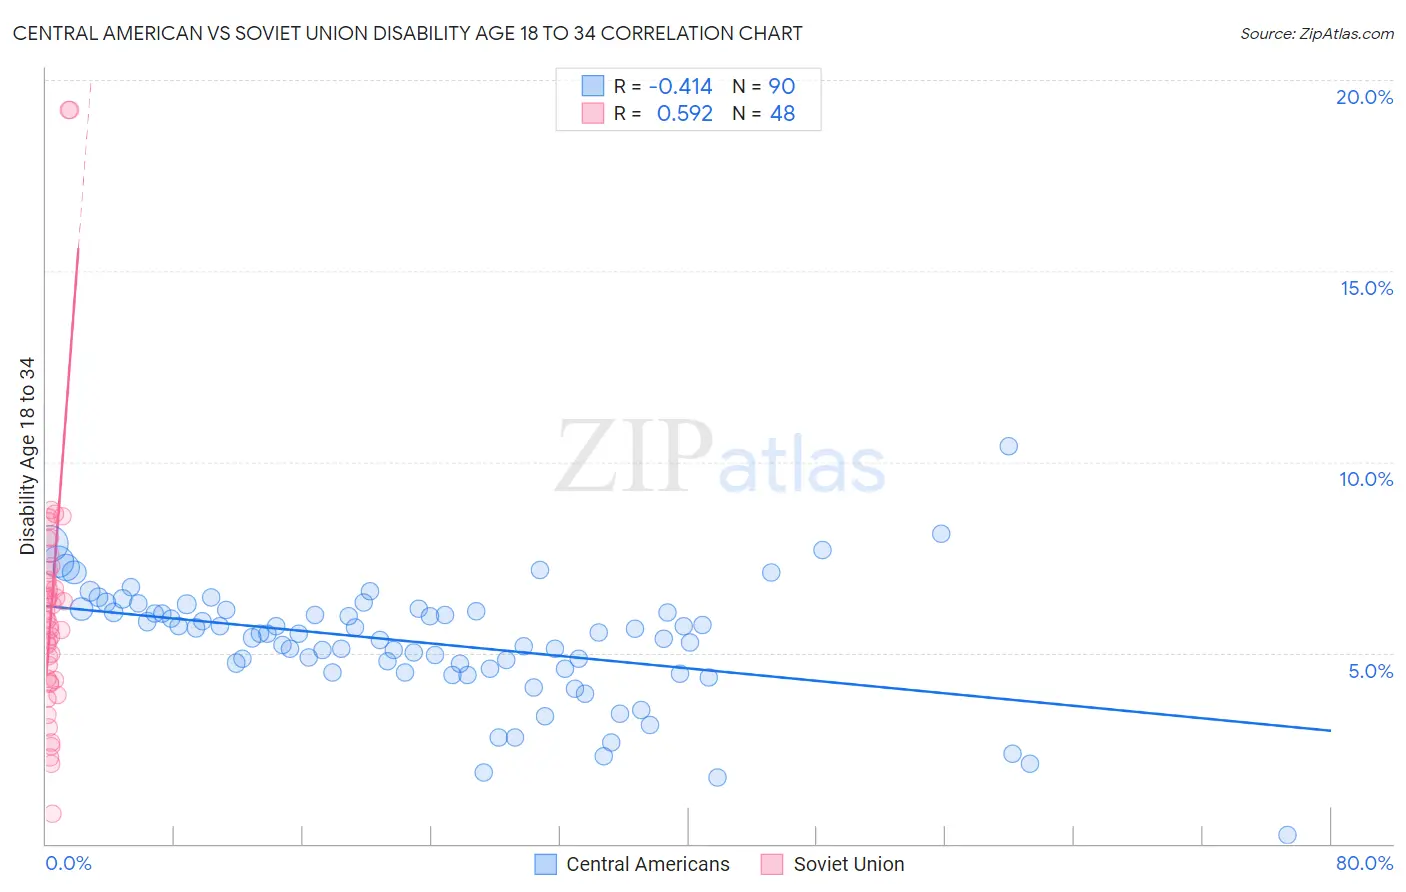
Central American vs Soviet Union Disability Age 18 to 34 Correlation Chart

The statistical analysis conducted on geographies consisting of 502,711,138 people shows a moderate negative correlation between the proportion of Central Americans and percentage of population with a disability between the ages 18 and 35 in the United States with a correlation coefficient (R) of -0.414 and weighted average of 6.2%. Similarly, the statistical analysis conducted on geographies consisting of 43,478,367 people shows a substantial positive correlation between the proportion of Soviet Union and percentage of population with a disability between the ages 18 and 35 in the United States with a correlation coefficient (R) of 0.592 and weighted average of 5.7%, a difference of 7.8%.
Central American vs Soviet Union Disability Age 18 to 34

Disability Age 18 to 34 Correlation Summary

MeasurementCentral AmericanSoviet Union
Minimum0.22%0.77%
Maximum10.4%19.2%
Range10.2%18.5%
Mean5.3%6.2%
Median5.5%5.9%
Interquartile 25% (IQ1)4.6%4.3%
Interquartile 75% (IQ3)6.1%7.0%
Interquartile Range (IQR)1.5%2.8%
Standard Deviation (Sample)1.5%3.3%
Standard Deviation (Population)1.5%3.3%

Similar Demographics by Disability Age 18 to 34

Demographics Similar to Central Americans by Disability Age 18 to 34

In terms of disability age 18 to 34, the demographic groups most similar to Central Americans are Immigrants from Kazakhstan (6.2%, a difference of 0.030%), Immigrants from Uruguay (6.2%, a difference of 0.050%), Immigrants (6.2%, a difference of 0.080%), Jordanian (6.2%, a difference of 0.10%), and Uruguayan (6.2%, a difference of 0.13%).
DemographicsRating | RankDisability Age 18 to 34
Cambodians
97.8
/100
|
#88
Exceptional
6.2%
Turks
97.8
/100
|
#89
Exceptional
6.2%
Immigrants | Vietnam
97.7
/100
|
#90
Exceptional
6.2%
Immigrants | Philippines
97.6
/100
|
#91
Exceptional
6.2%
Jordanians
97.6
/100
|
#92
Exceptional
6.2%
Immigrants | Immigrants
97.6
/100
|
#93
Exceptional
6.2%
Immigrants | Kazakhstan
97.5
/100
|
#94
Exceptional
6.2%
Central Americans
97.5
/100
|
#95
Exceptional
6.2%
Immigrants | Uruguay
97.4
/100
|
#96
Exceptional
6.2%
Uruguayans
97.3
/100
|
#97
Exceptional
6.2%
Immigrants | Syria
97.2
/100
|
#98
Exceptional
6.2%
Immigrants | Ethiopia
96.9
/100
|
#99
Exceptional
6.2%
Immigrants | Albania
96.7
/100
|
#100
Exceptional
6.2%
Immigrants | Jamaica
96.4
/100
|
#101
Exceptional
6.2%
Laotians
96.4
/100
|
#102
Exceptional
6.2%

Demographics Similar to Soviet Union by Disability Age 18 to 34

In terms of disability age 18 to 34, the demographic groups most similar to Soviet Union are Immigrants from Venezuela (5.7%, a difference of 0.090%), Immigrants from Ecuador (5.7%, a difference of 0.090%), Immigrants from Colombia (5.7%, a difference of 0.20%), Immigrants from Pakistan (5.8%, a difference of 0.29%), and Immigrants from Singapore (5.7%, a difference of 0.35%).
DemographicsRating | RankDisability Age 18 to 34
Immigrants | South Central Asia
100.0
/100
|
#21
Exceptional
5.7%
Immigrants | Nicaragua
100.0
/100
|
#22
Exceptional
5.7%
Cubans
100.0
/100
|
#23
Exceptional
5.7%
Immigrants | Argentina
100.0
/100
|
#24
Exceptional
5.7%
Immigrants | Singapore
100.0
/100
|
#25
Exceptional
5.7%
Immigrants | Colombia
100.0
/100
|
#26
Exceptional
5.7%
Immigrants | Venezuela
99.9
/100
|
#27
Exceptional
5.7%
Soviet Union
99.9
/100
|
#28
Exceptional
5.7%
Immigrants | Ecuador
99.9
/100
|
#29
Exceptional
5.7%
Immigrants | Pakistan
99.9
/100
|
#30
Exceptional
5.8%
Iranians
99.9
/100
|
#31
Exceptional
5.8%
Immigrants | Barbados
99.9
/100
|
#32
Exceptional
5.8%
Argentineans
99.9
/100
|
#33
Exceptional
5.8%
Venezuelans
99.9
/100
|
#34
Exceptional
5.8%
Immigrants | Lithuania
99.9
/100
|
#35
Exceptional
5.8%