Tohono O'odham vs Taiwanese Vision Disability
COMPARE
Tohono O'odham
Taiwanese
Vision Disability
Vision Disability Comparison
Tohono O'odham
Taiwanese
2.8%
VISION DISABILITY
0.0/ 100
METRIC RATING
319th/ 347
METRIC RANK
1.9%
VISION DISABILITY
99.9/ 100
METRIC RATING
27th/ 347
METRIC RANK
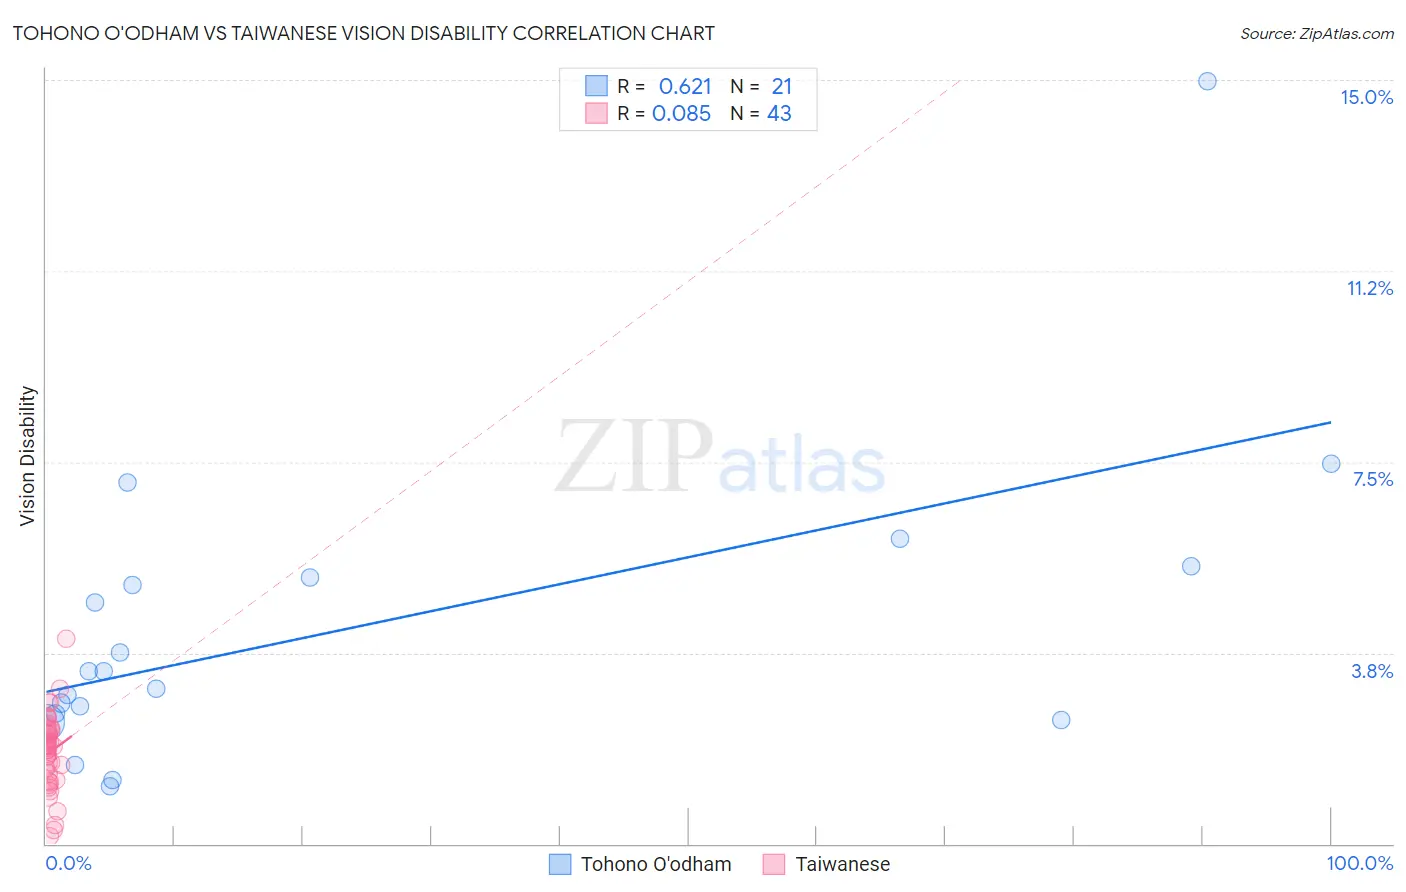
Tohono O'odham vs Taiwanese Vision Disability Correlation Chart
The statistical analysis conducted on geographies consisting of 58,710,192 people shows a significant positive correlation between the proportion of Tohono O'odham and percentage of population with vision disability in the United States with a correlation coefficient (R) of 0.621 and weighted average of 2.8%. Similarly, the statistical analysis conducted on geographies consisting of 31,721,885 people shows a slight positive correlation between the proportion of Taiwanese and percentage of population with vision disability in the United States with a correlation coefficient (R) of 0.085 and weighted average of 1.9%, a difference of 43.5%.
Vision Disability Correlation Summary
| Measurement | Tohono O'odham | Taiwanese |
| Minimum | 1.1% | 0.15% |
| Maximum | 15.0% | 4.0% |
| Range | 13.8% | 3.9% |
| Mean | 4.2% | 1.8% |
| Median | 3.4% | 1.9% |
| Interquartile 25% (IQ1) | 2.5% | 1.3% |
| Interquartile 75% (IQ3) | 5.3% | 2.3% |
| Interquartile Range (IQR) | 2.8% | 1.0% |
| Standard Deviation (Sample) | 3.0% | 0.75% |
| Standard Deviation (Population) | 3.0% | 0.74% |
Similar Demographics by Vision Disability
Demographics Similar to Tohono O'odham by Vision Disability
In terms of vision disability, the demographic groups most similar to Tohono O'odham are Black/African American (2.8%, a difference of 0.69%), Alaska Native (2.7%, a difference of 1.4%), Yup'ik (2.7%, a difference of 2.5%), Comanche (2.8%, a difference of 2.7%), and Shoshone (2.7%, a difference of 2.7%).
| Demographics | Rating | Rank | Vision Disability |
| Americans | 0.0 /100 | #312 | Tragic 2.6% |
| Potawatomi | 0.0 /100 | #313 | Tragic 2.6% |
| Inupiat | 0.0 /100 | #314 | Tragic 2.7% |
| Osage | 0.0 /100 | #315 | Tragic 2.7% |
| Shoshone | 0.0 /100 | #316 | Tragic 2.7% |
| Yup'ik | 0.0 /100 | #317 | Tragic 2.7% |
| Alaska Natives | 0.0 /100 | #318 | Tragic 2.7% |
| Tohono O'odham | 0.0 /100 | #319 | Tragic 2.8% |
| Blacks/African Americans | 0.0 /100 | #320 | Tragic 2.8% |
| Comanche | 0.0 /100 | #321 | Tragic 2.8% |
| Paiute | 0.0 /100 | #322 | Tragic 2.9% |
| Tlingit-Haida | 0.0 /100 | #323 | Tragic 2.9% |
| Hopi | 0.0 /100 | #324 | Tragic 2.9% |
| Cherokee | 0.0 /100 | #325 | Tragic 2.9% |
| Spanish Americans | 0.0 /100 | #326 | Tragic 2.9% |
Demographics Similar to Taiwanese by Vision Disability
In terms of vision disability, the demographic groups most similar to Taiwanese are Immigrants from Malaysia (1.9%, a difference of 0.020%), Egyptian (1.9%, a difference of 0.090%), Immigrants from Nepal (1.9%, a difference of 0.13%), Mongolian (1.9%, a difference of 0.29%), and Immigrants from Japan (1.9%, a difference of 0.34%).
| Demographics | Rating | Rank | Vision Disability |
| Asians | 100.0 /100 | #20 | Exceptional 1.9% |
| Turks | 100.0 /100 | #21 | Exceptional 1.9% |
| Immigrants | Pakistan | 100.0 /100 | #22 | Exceptional 1.9% |
| Immigrants | Asia | 99.9 /100 | #23 | Exceptional 1.9% |
| Immigrants | Lithuania | 99.9 /100 | #24 | Exceptional 1.9% |
| Bulgarians | 99.9 /100 | #25 | Exceptional 1.9% |
| Immigrants | Japan | 99.9 /100 | #26 | Exceptional 1.9% |
| Taiwanese | 99.9 /100 | #27 | Exceptional 1.9% |
| Immigrants | Malaysia | 99.9 /100 | #28 | Exceptional 1.9% |
| Egyptians | 99.9 /100 | #29 | Exceptional 1.9% |
| Immigrants | Nepal | 99.9 /100 | #30 | Exceptional 1.9% |
| Mongolians | 99.9 /100 | #31 | Exceptional 1.9% |
| Luxembourgers | 99.9 /100 | #32 | Exceptional 1.9% |
| Immigrants | Egypt | 99.9 /100 | #33 | Exceptional 1.9% |
| Immigrants | Turkey | 99.8 /100 | #34 | Exceptional 1.9% |