Swedish vs Zimbabwean Per Capita Income
COMPARE
Swedish
Zimbabwean
Per Capita Income
Per Capita Income Comparison
Swedes
Zimbabweans
$45,750
PER CAPITA INCOME
91.3/ 100
METRIC RATING
128th/ 347
METRIC RANK
$45,804
PER CAPITA INCOME
91.7/ 100
METRIC RATING
125th/ 347
METRIC RANK
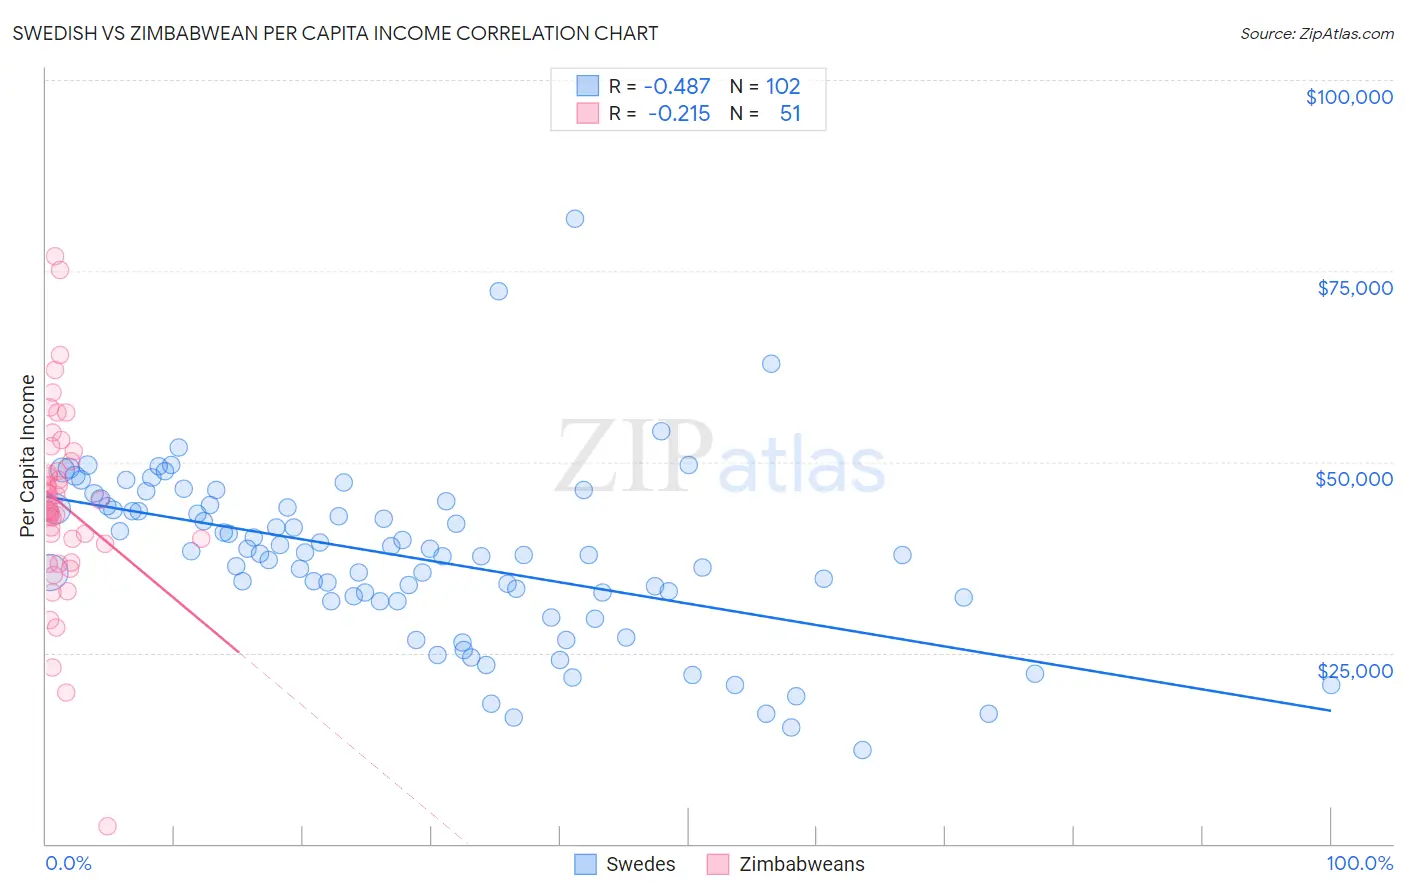
Swedish vs Zimbabwean Per Capita Income Correlation Chart
The statistical analysis conducted on geographies consisting of 539,281,463 people shows a moderate negative correlation between the proportion of Swedes and per capita income in the United States with a correlation coefficient (R) of -0.487 and weighted average of $45,750. Similarly, the statistical analysis conducted on geographies consisting of 69,200,621 people shows a weak negative correlation between the proportion of Zimbabweans and per capita income in the United States with a correlation coefficient (R) of -0.215 and weighted average of $45,804, a difference of 0.12%.
Per Capita Income Correlation Summary
| Measurement | Swedish | Zimbabwean |
| Minimum | $12,332 | $2,302 |
| Maximum | $81,765 | $76,842 |
| Range | $69,433 | $74,540 |
| Mean | $37,501 | $44,445 |
| Median | $37,895 | $44,038 |
| Interquartile 25% (IQ1) | $31,815 | $39,330 |
| Interquartile 75% (IQ3) | $44,149 | $50,052 |
| Interquartile Range (IQR) | $12,334 | $10,722 |
| Standard Deviation (Sample) | $11,325 | $12,469 |
| Standard Deviation (Population) | $11,269 | $12,346 |
Demographics Similar to Swedes and Zimbabweans by Per Capita Income
In terms of per capita income, the demographic groups most similar to Swedes are Immigrants from Germany ($45,751, a difference of 0.0%), Palestinian ($45,790, a difference of 0.090%), European ($45,836, a difference of 0.19%), Luxembourger ($45,663, a difference of 0.19%), and Arab ($45,662, a difference of 0.19%). Similarly, the demographic groups most similar to Zimbabweans are Palestinian ($45,790, a difference of 0.030%), European ($45,836, a difference of 0.070%), Lebanese ($45,840, a difference of 0.080%), Moroccan ($45,854, a difference of 0.11%), and Canadian ($45,858, a difference of 0.12%).
| Demographics | Rating | Rank | Per Capita Income |
| Poles | 94.1 /100 | #116 | Exceptional $46,123 |
| Chinese | 93.9 /100 | #117 | Exceptional $46,098 |
| Immigrants | Saudi Arabia | 93.3 /100 | #118 | Exceptional $46,008 |
| Immigrants | Poland | 93.1 /100 | #119 | Exceptional $45,979 |
| Immigrants | Ethiopia | 92.7 /100 | #120 | Exceptional $45,923 |
| Canadians | 92.2 /100 | #121 | Exceptional $45,858 |
| Moroccans | 92.1 /100 | #122 | Exceptional $45,854 |
| Lebanese | 92.0 /100 | #123 | Exceptional $45,840 |
| Europeans | 92.0 /100 | #124 | Exceptional $45,836 |
| Zimbabweans | 91.7 /100 | #125 | Exceptional $45,804 |
| Palestinians | 91.6 /100 | #126 | Exceptional $45,790 |
| Immigrants | Germany | 91.3 /100 | #127 | Exceptional $45,751 |
| Swedes | 91.3 /100 | #128 | Exceptional $45,750 |
| Luxembourgers | 90.4 /100 | #129 | Exceptional $45,663 |
| Arabs | 90.4 /100 | #130 | Exceptional $45,662 |
| Immigrants | North Macedonia | 90.0 /100 | #131 | Exceptional $45,622 |
| Jordanians | 89.9 /100 | #132 | Excellent $45,605 |
| Pakistanis | 89.7 /100 | #133 | Excellent $45,587 |
| Slovenes | 89.6 /100 | #134 | Excellent $45,581 |
| Hungarians | 87.9 /100 | #135 | Excellent $45,426 |
| Immigrants | Oceania | 85.2 /100 | #136 | Excellent $45,220 |