Swedish vs Burmese Disability Age Over 75
COMPARE
Swedish
Burmese
Disability Age Over 75
Disability Age Over 75 Comparison
Swedes
Burmese
45.7%
DISABILITY AGE OVER 75
99.8/ 100
METRIC RATING
46th/ 347
METRIC RANK
45.9%
DISABILITY AGE OVER 75
99.5/ 100
METRIC RATING
62nd/ 347
METRIC RANK
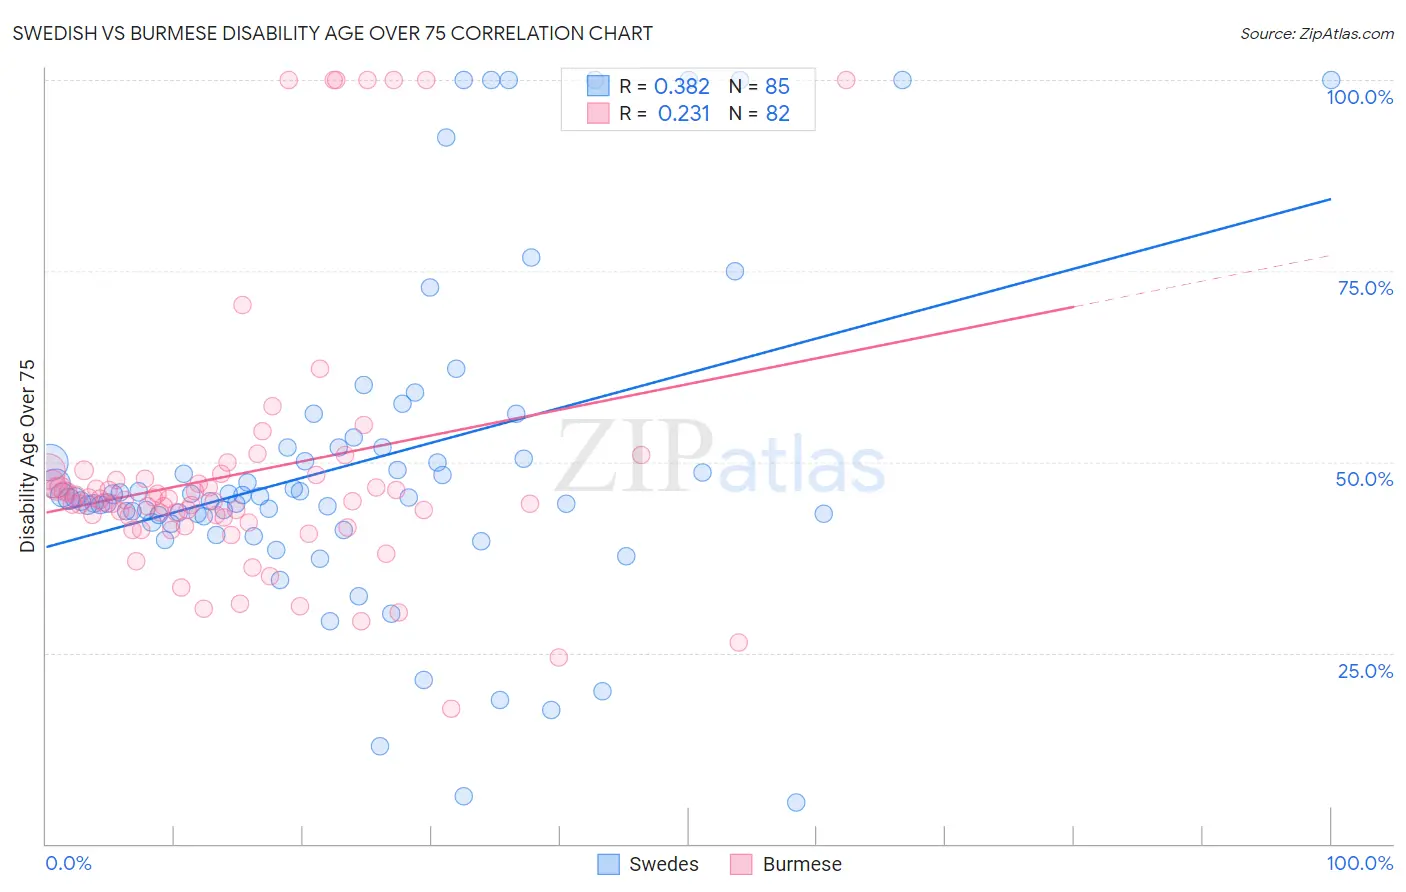
Swedish vs Burmese Disability Age Over 75 Correlation Chart
The statistical analysis conducted on geographies consisting of 537,534,553 people shows a mild positive correlation between the proportion of Swedes and percentage of population with a disability over the age of 75 in the United States with a correlation coefficient (R) of 0.382 and weighted average of 45.7%. Similarly, the statistical analysis conducted on geographies consisting of 463,970,259 people shows a weak positive correlation between the proportion of Burmese and percentage of population with a disability over the age of 75 in the United States with a correlation coefficient (R) of 0.231 and weighted average of 45.9%, a difference of 0.51%.
Disability Age Over 75 Correlation Summary
| Measurement | Swedish | Burmese |
| Minimum | 5.4% | 17.7% |
| Maximum | 100.0% | 100.0% |
| Range | 94.6% | 82.3% |
| Mean | 49.7% | 48.5% |
| Median | 45.3% | 44.9% |
| Interquartile 25% (IQ1) | 42.5% | 42.1% |
| Interquartile 75% (IQ3) | 51.8% | 47.8% |
| Interquartile Range (IQR) | 9.4% | 5.7% |
| Standard Deviation (Sample) | 20.9% | 17.5% |
| Standard Deviation (Population) | 20.7% | 17.4% |
Demographics Similar to Swedes and Burmese by Disability Age Over 75
In terms of disability age over 75, the demographic groups most similar to Swedes are Immigrants from Canada (45.7%, a difference of 0.020%), Croatian (45.7%, a difference of 0.020%), Australian (45.7%, a difference of 0.030%), Turkish (45.7%, a difference of 0.030%), and Immigrants from North America (45.7%, a difference of 0.090%). Similarly, the demographic groups most similar to Burmese are Immigrants from Argentina (45.9%, a difference of 0.030%), Iranian (45.9%, a difference of 0.050%), Immigrants from Europe (45.9%, a difference of 0.050%), Immigrants from Norway (45.9%, a difference of 0.050%), and Immigrants from North Macedonia (45.9%, a difference of 0.050%).
| Demographics | Rating | Rank | Disability Age Over 75 |
| Australians | 99.8 /100 | #44 | Exceptional 45.7% |
| Turks | 99.8 /100 | #45 | Exceptional 45.7% |
| Swedes | 99.8 /100 | #46 | Exceptional 45.7% |
| Immigrants | Canada | 99.8 /100 | #47 | Exceptional 45.7% |
| Croatians | 99.8 /100 | #48 | Exceptional 45.7% |
| Immigrants | North America | 99.8 /100 | #49 | Exceptional 45.7% |
| Belgians | 99.7 /100 | #50 | Exceptional 45.8% |
| Immigrants | Korea | 99.7 /100 | #51 | Exceptional 45.8% |
| Immigrants | France | 99.7 /100 | #52 | Exceptional 45.8% |
| Immigrants | Italy | 99.7 /100 | #53 | Exceptional 45.8% |
| Slovaks | 99.6 /100 | #54 | Exceptional 45.8% |
| Maltese | 99.6 /100 | #55 | Exceptional 45.8% |
| Immigrants | Netherlands | 99.6 /100 | #56 | Exceptional 45.9% |
| Immigrants | Turkey | 99.6 /100 | #57 | Exceptional 45.9% |
| Immigrants | Israel | 99.6 /100 | #58 | Exceptional 45.9% |
| Iranians | 99.6 /100 | #59 | Exceptional 45.9% |
| Immigrants | Europe | 99.6 /100 | #60 | Exceptional 45.9% |
| Immigrants | Argentina | 99.6 /100 | #61 | Exceptional 45.9% |
| Burmese | 99.5 /100 | #62 | Exceptional 45.9% |
| Immigrants | Norway | 99.5 /100 | #63 | Exceptional 45.9% |
| Immigrants | North Macedonia | 99.5 /100 | #64 | Exceptional 45.9% |