Swedish vs Ghanaian Self-Care Disability
COMPARE
Swedish
Ghanaian
Self-Care Disability
Self-Care Disability Comparison
Swedes
Ghanaians
2.3%
SELF-CARE DISABILITY
99.3/ 100
METRIC RATING
64th/ 347
METRIC RANK
2.5%
SELF-CARE DISABILITY
40.4/ 100
METRIC RATING
181st/ 347
METRIC RANK
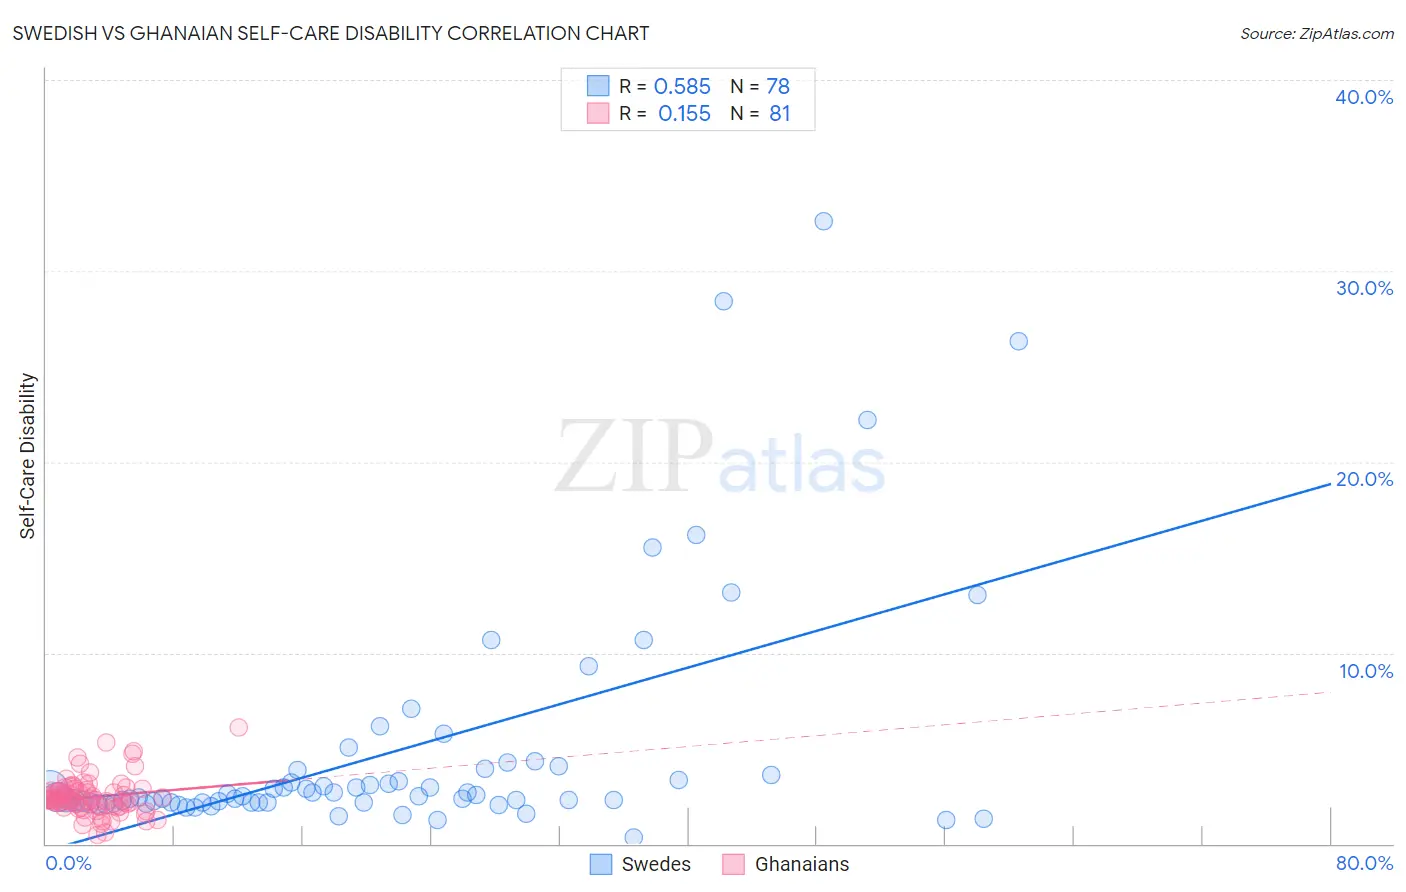
Swedish vs Ghanaian Self-Care Disability Correlation Chart
The statistical analysis conducted on geographies consisting of 537,435,418 people shows a substantial positive correlation between the proportion of Swedes and percentage of population with self-care disability in the United States with a correlation coefficient (R) of 0.585 and weighted average of 2.3%. Similarly, the statistical analysis conducted on geographies consisting of 190,499,518 people shows a poor positive correlation between the proportion of Ghanaians and percentage of population with self-care disability in the United States with a correlation coefficient (R) of 0.155 and weighted average of 2.5%, a difference of 6.9%.
Self-Care Disability Correlation Summary
| Measurement | Swedish | Ghanaian |
| Minimum | 0.30% | 0.46% |
| Maximum | 32.6% | 6.1% |
| Range | 32.3% | 5.6% |
| Mean | 4.8% | 2.5% |
| Median | 2.5% | 2.3% |
| Interquartile 25% (IQ1) | 2.1% | 1.9% |
| Interquartile 75% (IQ3) | 3.9% | 2.8% |
| Interquartile Range (IQR) | 1.7% | 0.86% |
| Standard Deviation (Sample) | 6.2% | 0.97% |
| Standard Deviation (Population) | 6.2% | 0.97% |
Similar Demographics by Self-Care Disability
Demographics Similar to Swedes by Self-Care Disability
In terms of self-care disability, the demographic groups most similar to Swedes are Mongolian (2.3%, a difference of 0.010%), Brazilian (2.3%, a difference of 0.060%), Egyptian (2.3%, a difference of 0.090%), Immigrants from Argentina (2.3%, a difference of 0.090%), and South African (2.3%, a difference of 0.12%).
| Demographics | Rating | Rank | Self-Care Disability |
| Immigrants | Belgium | 99.6 /100 | #57 | Exceptional 2.3% |
| Immigrants | Cameroon | 99.6 /100 | #58 | Exceptional 2.3% |
| New Zealanders | 99.5 /100 | #59 | Exceptional 2.3% |
| Immigrants | Japan | 99.5 /100 | #60 | Exceptional 2.3% |
| Palestinians | 99.4 /100 | #61 | Exceptional 2.3% |
| Egyptians | 99.4 /100 | #62 | Exceptional 2.3% |
| Mongolians | 99.3 /100 | #63 | Exceptional 2.3% |
| Swedes | 99.3 /100 | #64 | Exceptional 2.3% |
| Brazilians | 99.3 /100 | #65 | Exceptional 2.3% |
| Immigrants | Argentina | 99.3 /100 | #66 | Exceptional 2.3% |
| South Africans | 99.3 /100 | #67 | Exceptional 2.3% |
| Immigrants | Zaire | 99.2 /100 | #68 | Exceptional 2.3% |
| Immigrants | Norway | 99.2 /100 | #69 | Exceptional 2.3% |
| Immigrants | Northern Europe | 99.2 /100 | #70 | Exceptional 2.3% |
| Asians | 99.2 /100 | #71 | Exceptional 2.3% |
Demographics Similar to Ghanaians by Self-Care Disability
In terms of self-care disability, the demographic groups most similar to Ghanaians are Indonesian (2.5%, a difference of 0.040%), Maltese (2.5%, a difference of 0.14%), Salvadoran (2.5%, a difference of 0.20%), Yugoslavian (2.5%, a difference of 0.21%), and Hungarian (2.5%, a difference of 0.25%).
| Demographics | Rating | Rank | Self-Care Disability |
| Welsh | 50.0 /100 | #174 | Average 2.5% |
| Immigrants | Bosnia and Herzegovina | 49.6 /100 | #175 | Average 2.5% |
| Immigrants | Afghanistan | 47.6 /100 | #176 | Average 2.5% |
| Immigrants | Kazakhstan | 46.7 /100 | #177 | Average 2.5% |
| English | 46.2 /100 | #178 | Average 2.5% |
| Hungarians | 45.5 /100 | #179 | Average 2.5% |
| Indonesians | 41.2 /100 | #180 | Average 2.5% |
| Ghanaians | 40.4 /100 | #181 | Average 2.5% |
| Maltese | 37.5 /100 | #182 | Fair 2.5% |
| Salvadorans | 36.4 /100 | #183 | Fair 2.5% |
| Yugoslavians | 36.1 /100 | #184 | Fair 2.5% |
| Slavs | 34.3 /100 | #185 | Fair 2.5% |
| Immigrants | El Salvador | 33.0 /100 | #186 | Fair 2.5% |
| Irish | 28.7 /100 | #187 | Fair 2.5% |
| Immigrants | Oceania | 28.3 /100 | #188 | Fair 2.5% |