Swedish vs Ghanaian College, Under 1 year
COMPARE
Swedish
Ghanaian
College, Under 1 year
College, Under 1 year Comparison
Swedes
Ghanaians
68.7%
COLLEGE, UNDER 1 YEAR
98.9/ 100
METRIC RATING
74th/ 347
METRIC RANK
63.9%
COLLEGE, UNDER 1 YEAR
11.2/ 100
METRIC RATING
210th/ 347
METRIC RANK
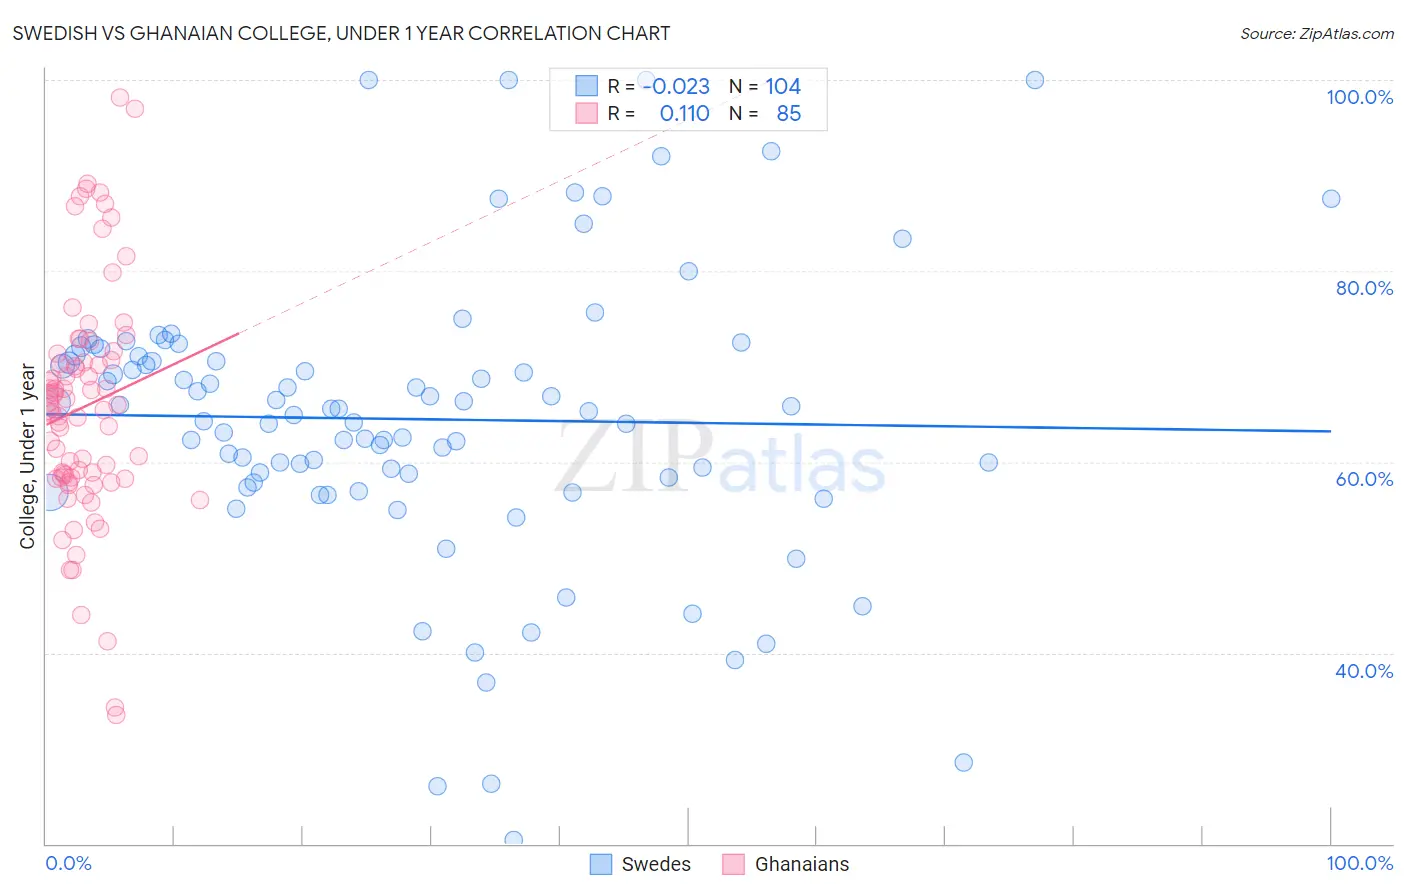
Swedish vs Ghanaian College, Under 1 year Correlation Chart
The statistical analysis conducted on geographies consisting of 539,226,208 people shows no correlation between the proportion of Swedes and percentage of population with at least college, under 1 year education in the United States with a correlation coefficient (R) of -0.023 and weighted average of 68.7%. Similarly, the statistical analysis conducted on geographies consisting of 190,712,650 people shows a poor positive correlation between the proportion of Ghanaians and percentage of population with at least college, under 1 year education in the United States with a correlation coefficient (R) of 0.110 and weighted average of 63.9%, a difference of 7.4%.
College, Under 1 year Correlation Summary
| Measurement | Swedish | Ghanaian |
| Minimum | 20.5% | 33.5% |
| Maximum | 100.0% | 98.2% |
| Range | 79.5% | 64.7% |
| Mean | 64.5% | 65.8% |
| Median | 65.4% | 65.7% |
| Interquartile 25% (IQ1) | 58.1% | 58.3% |
| Interquartile 75% (IQ3) | 71.1% | 71.0% |
| Interquartile Range (IQR) | 13.1% | 12.7% |
| Standard Deviation (Sample) | 15.1% | 12.3% |
| Standard Deviation (Population) | 15.0% | 12.3% |
Similar Demographics by College, Under 1 year
Demographics Similar to Swedes by College, Under 1 year
In terms of college, under 1 year, the demographic groups most similar to Swedes are Immigrants from England (68.7%, a difference of 0.060%), Bolivian (68.7%, a difference of 0.090%), Immigrants from Europe (68.8%, a difference of 0.14%), Lithuanian (68.8%, a difference of 0.15%), and Immigrants from Western Europe (68.5%, a difference of 0.25%).
| Demographics | Rating | Rank | College, Under 1 year |
| Immigrants | Zimbabwe | 99.2 /100 | #67 | Exceptional 68.9% |
| Immigrants | Indonesia | 99.2 /100 | #68 | Exceptional 68.9% |
| Immigrants | Romania | 99.2 /100 | #69 | Exceptional 68.9% |
| Lithuanians | 99.1 /100 | #70 | Exceptional 68.8% |
| Immigrants | Europe | 99.1 /100 | #71 | Exceptional 68.8% |
| Bolivians | 99.0 /100 | #72 | Exceptional 68.7% |
| Immigrants | England | 99.0 /100 | #73 | Exceptional 68.7% |
| Swedes | 98.9 /100 | #74 | Exceptional 68.7% |
| Immigrants | Western Europe | 98.6 /100 | #75 | Exceptional 68.5% |
| Laotians | 98.6 /100 | #76 | Exceptional 68.5% |
| British | 98.6 /100 | #77 | Exceptional 68.5% |
| Danes | 98.6 /100 | #78 | Exceptional 68.5% |
| Greeks | 98.6 /100 | #79 | Exceptional 68.5% |
| Immigrants | Spain | 98.5 /100 | #80 | Exceptional 68.4% |
| Immigrants | Greece | 98.5 /100 | #81 | Exceptional 68.4% |
Demographics Similar to Ghanaians by College, Under 1 year
In terms of college, under 1 year, the demographic groups most similar to Ghanaians are Puget Sound Salish (63.9%, a difference of 0.010%), Native Hawaiian (63.9%, a difference of 0.070%), Immigrants from Middle Africa (63.9%, a difference of 0.080%), Immigrants from Vietnam (64.0%, a difference of 0.10%), and Colombian (64.0%, a difference of 0.13%).
| Demographics | Rating | Rank | College, Under 1 year |
| Uruguayans | 15.6 /100 | #203 | Poor 64.2% |
| Immigrants | Zaire | 14.6 /100 | #204 | Poor 64.1% |
| Peruvians | 13.7 /100 | #205 | Poor 64.1% |
| Whites/Caucasians | 12.8 /100 | #206 | Poor 64.0% |
| Colombians | 12.4 /100 | #207 | Poor 64.0% |
| Immigrants | Vietnam | 12.1 /100 | #208 | Poor 64.0% |
| Puget Sound Salish | 11.3 /100 | #209 | Poor 63.9% |
| Ghanaians | 11.2 /100 | #210 | Poor 63.9% |
| Native Hawaiians | 10.6 /100 | #211 | Poor 63.9% |
| Immigrants | Middle Africa | 10.5 /100 | #212 | Poor 63.9% |
| Immigrants | South America | 9.1 /100 | #213 | Tragic 63.8% |
| Immigrants | Nigeria | 8.8 /100 | #214 | Tragic 63.7% |
| Senegalese | 7.7 /100 | #215 | Tragic 63.6% |
| Hmong | 6.8 /100 | #216 | Tragic 63.5% |
| Immigrants | Uruguay | 5.8 /100 | #217 | Tragic 63.4% |