Swedish vs Welsh Female Disability
COMPARE
Swedish
Welsh
Female Disability
Female Disability Comparison
Swedes
Welsh
12.3%
FEMALE DISABILITY
26.6/ 100
METRIC RATING
195th/ 347
METRIC RANK
13.1%
FEMALE DISABILITY
0.0/ 100
METRIC RATING
282nd/ 347
METRIC RANK
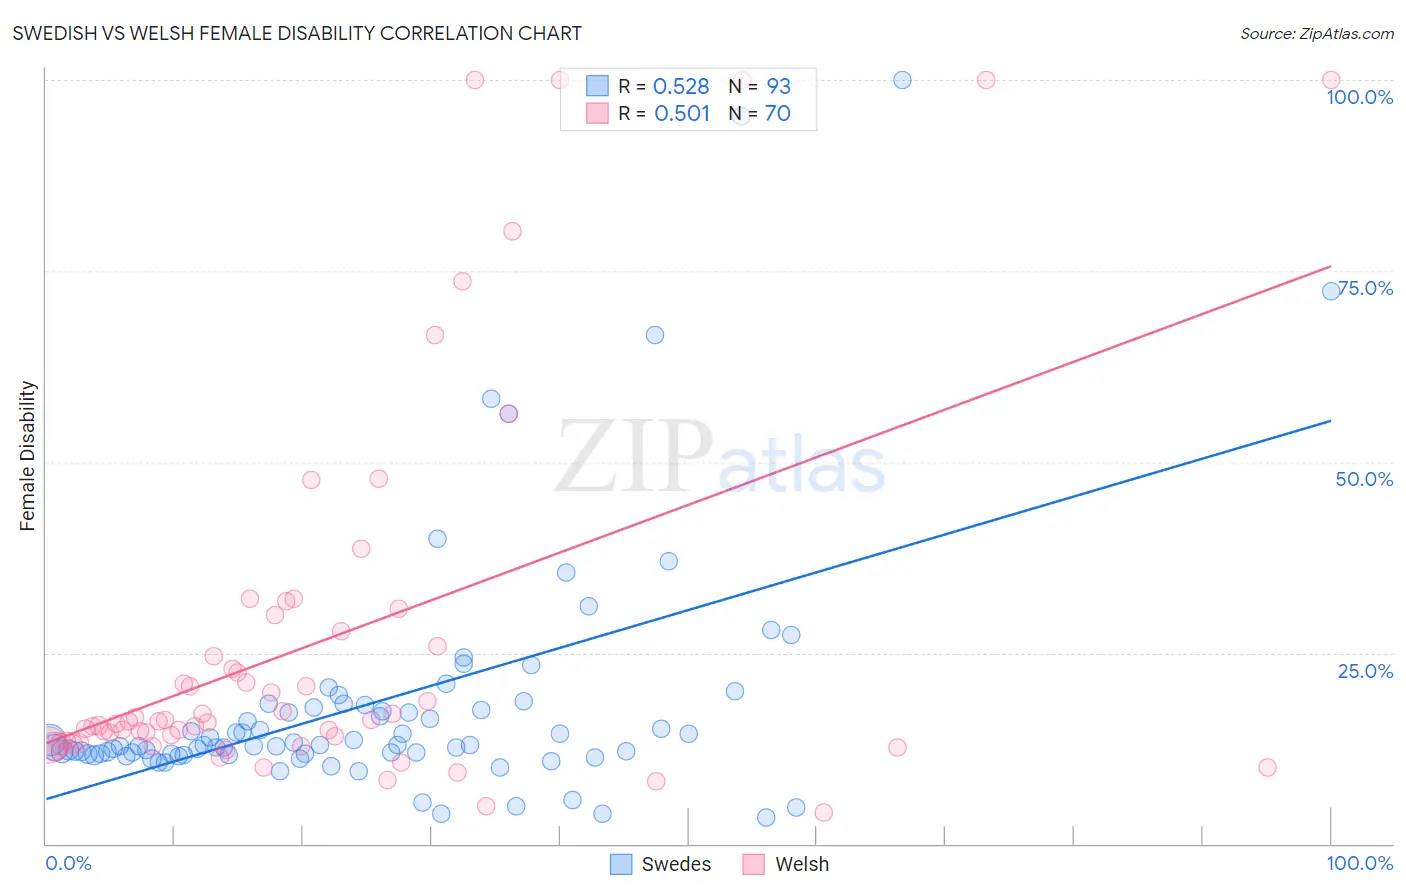
Swedish vs Welsh Female Disability Correlation Chart
The statistical analysis conducted on geographies consisting of 539,030,282 people shows a substantial positive correlation between the proportion of Swedes and percentage of females with a disability in the United States with a correlation coefficient (R) of 0.528 and weighted average of 12.3%. Similarly, the statistical analysis conducted on geographies consisting of 528,453,595 people shows a substantial positive correlation between the proportion of Welsh and percentage of females with a disability in the United States with a correlation coefficient (R) of 0.501 and weighted average of 13.1%, a difference of 6.2%.
Female Disability Correlation Summary
| Measurement | Swedish | Welsh |
| Minimum | 3.5% | 4.2% |
| Maximum | 100.0% | 100.0% |
| Range | 96.5% | 95.8% |
| Mean | 18.5% | 26.8% |
| Median | 12.9% | 16.1% |
| Interquartile 25% (IQ1) | 11.7% | 13.2% |
| Interquartile 75% (IQ3) | 18.0% | 27.8% |
| Interquartile Range (IQR) | 6.3% | 14.7% |
| Standard Deviation (Sample) | 16.8% | 25.2% |
| Standard Deviation (Population) | 16.7% | 25.0% |
Similar Demographics by Female Disability
Demographics Similar to Swedes by Female Disability
In terms of female disability, the demographic groups most similar to Swedes are Ukrainian (12.3%, a difference of 0.030%), Northern European (12.3%, a difference of 0.040%), Immigrants from Panama (12.3%, a difference of 0.060%), Honduran (12.3%, a difference of 0.060%), and Mexican American Indian (12.3%, a difference of 0.080%).
| Demographics | Rating | Rank | Female Disability |
| Immigrants | North America | 32.8 /100 | #188 | Fair 12.3% |
| Immigrants | Albania | 31.6 /100 | #189 | Fair 12.3% |
| Immigrants | Honduras | 31.3 /100 | #190 | Fair 12.3% |
| Armenians | 29.7 /100 | #191 | Fair 12.3% |
| Immigrants | Western Africa | 29.2 /100 | #192 | Fair 12.3% |
| Northern Europeans | 27.5 /100 | #193 | Fair 12.3% |
| Ukrainians | 27.2 /100 | #194 | Fair 12.3% |
| Swedes | 26.6 /100 | #195 | Fair 12.3% |
| Immigrants | Panama | 25.5 /100 | #196 | Fair 12.3% |
| Hondurans | 25.4 /100 | #197 | Fair 12.3% |
| Mexican American Indians | 24.9 /100 | #198 | Fair 12.3% |
| Immigrants | Trinidad and Tobago | 24.7 /100 | #199 | Fair 12.3% |
| Trinidadians and Tobagonians | 22.4 /100 | #200 | Fair 12.3% |
| Chinese | 22.1 /100 | #201 | Fair 12.3% |
| Somalis | 21.5 /100 | #202 | Fair 12.3% |
Demographics Similar to Welsh by Female Disability
In terms of female disability, the demographic groups most similar to Welsh are English (13.1%, a difference of 0.0%), U.S. Virgin Islander (13.1%, a difference of 0.080%), Irish (13.1%, a difference of 0.11%), Hmong (13.1%, a difference of 0.14%), and Bangladeshi (13.1%, a difference of 0.19%).
| Demographics | Rating | Rank | Female Disability |
| Cheyenne | 0.1 /100 | #275 | Tragic 13.0% |
| Immigrants | Dominica | 0.1 /100 | #276 | Tragic 13.0% |
| Spanish | 0.1 /100 | #277 | Tragic 13.0% |
| Scottish | 0.1 /100 | #278 | Tragic 13.0% |
| Arapaho | 0.1 /100 | #279 | Tragic 13.0% |
| Irish | 0.1 /100 | #280 | Tragic 13.1% |
| U.S. Virgin Islanders | 0.1 /100 | #281 | Tragic 13.1% |
| Welsh | 0.0 /100 | #282 | Tragic 13.1% |
| English | 0.0 /100 | #283 | Tragic 13.1% |
| Hmong | 0.0 /100 | #284 | Tragic 13.1% |
| Bangladeshis | 0.0 /100 | #285 | Tragic 13.1% |
| Fijians | 0.0 /100 | #286 | Tragic 13.1% |
| Yaqui | 0.0 /100 | #287 | Tragic 13.2% |
| Whites/Caucasians | 0.0 /100 | #288 | Tragic 13.2% |
| Tlingit-Haida | 0.0 /100 | #289 | Tragic 13.2% |