Shoshone vs Bolivian Disability Age 35 to 64
COMPARE
Shoshone
Bolivian
Disability Age 35 to 64
Disability Age 35 to 64 Comparison
Shoshone
Bolivians
14.5%
DISABILITY AGE 35 TO 64
0.0/ 100
METRIC RATING
314th/ 347
METRIC RANK
8.9%
DISABILITY AGE 35 TO 64
100.0/ 100
METRIC RATING
15th/ 347
METRIC RANK
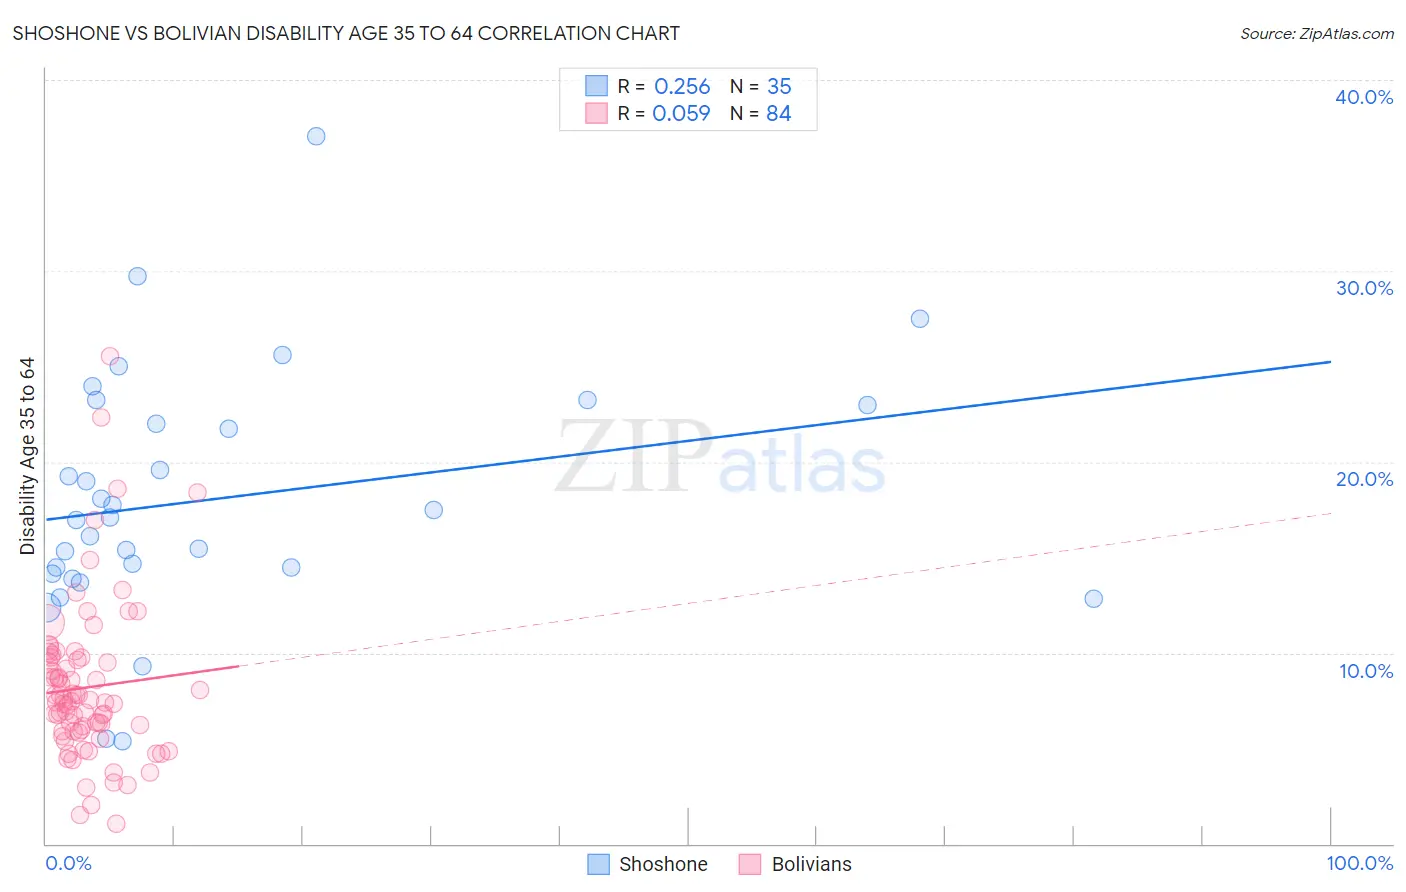
Shoshone vs Bolivian Disability Age 35 to 64 Correlation Chart
The statistical analysis conducted on geographies consisting of 66,618,836 people shows a weak positive correlation between the proportion of Shoshone and percentage of population with a disability between the ages 34 and 64 in the United States with a correlation coefficient (R) of 0.256 and weighted average of 14.5%. Similarly, the statistical analysis conducted on geographies consisting of 184,604,467 people shows a slight positive correlation between the proportion of Bolivians and percentage of population with a disability between the ages 34 and 64 in the United States with a correlation coefficient (R) of 0.059 and weighted average of 8.9%, a difference of 61.7%.
Disability Age 35 to 64 Correlation Summary
| Measurement | Shoshone | Bolivian |
| Minimum | 5.4% | 1.0% |
| Maximum | 37.1% | 25.5% |
| Range | 31.7% | 24.5% |
| Mean | 18.1% | 8.2% |
| Median | 17.1% | 7.5% |
| Interquartile 25% (IQ1) | 14.1% | 5.9% |
| Interquartile 75% (IQ3) | 23.0% | 9.7% |
| Interquartile Range (IQR) | 8.9% | 3.8% |
| Standard Deviation (Sample) | 6.5% | 4.1% |
| Standard Deviation (Population) | 6.4% | 4.1% |
Similar Demographics by Disability Age 35 to 64
Demographics Similar to Shoshone by Disability Age 35 to 64
In terms of disability age 35 to 64, the demographic groups most similar to Shoshone are Alaska Native (14.5%, a difference of 0.020%), Osage (14.5%, a difference of 0.21%), Iroquois (14.4%, a difference of 0.76%), Crow (14.6%, a difference of 1.1%), and Ottawa (14.6%, a difference of 1.2%).
| Demographics | Rating | Rank | Disability Age 35 to 64 |
| Blackfeet | 0.0 /100 | #307 | Tragic 14.1% |
| Inupiat | 0.0 /100 | #308 | Tragic 14.1% |
| Cree | 0.0 /100 | #309 | Tragic 14.1% |
| Cape Verdeans | 0.0 /100 | #310 | Tragic 14.1% |
| Immigrants | Azores | 0.0 /100 | #311 | Tragic 14.3% |
| Paiute | 0.0 /100 | #312 | Tragic 14.3% |
| Iroquois | 0.0 /100 | #313 | Tragic 14.4% |
| Shoshone | 0.0 /100 | #314 | Tragic 14.5% |
| Alaska Natives | 0.0 /100 | #315 | Tragic 14.5% |
| Osage | 0.0 /100 | #316 | Tragic 14.5% |
| Crow | 0.0 /100 | #317 | Tragic 14.6% |
| Ottawa | 0.0 /100 | #318 | Tragic 14.6% |
| Immigrants | Cabo Verde | 0.0 /100 | #319 | Tragic 14.7% |
| Blacks/African Americans | 0.0 /100 | #320 | Tragic 14.7% |
| Comanche | 0.0 /100 | #321 | Tragic 14.7% |
Demographics Similar to Bolivians by Disability Age 35 to 64
In terms of disability age 35 to 64, the demographic groups most similar to Bolivians are Immigrants from Singapore (8.9%, a difference of 0.29%), Immigrants from Korea (9.0%, a difference of 0.34%), Immigrants from South Central Asia (8.9%, a difference of 0.89%), Indian (Asian) (8.9%, a difference of 0.98%), and Immigrants from Eastern Asia (8.8%, a difference of 1.8%).
| Demographics | Rating | Rank | Disability Age 35 to 64 |
| Iranians | 100.0 /100 | #8 | Exceptional 8.7% |
| Immigrants | China | 100.0 /100 | #9 | Exceptional 8.7% |
| Immigrants | Bolivia | 100.0 /100 | #10 | Exceptional 8.7% |
| Immigrants | Eastern Asia | 100.0 /100 | #11 | Exceptional 8.8% |
| Indians (Asian) | 100.0 /100 | #12 | Exceptional 8.9% |
| Immigrants | South Central Asia | 100.0 /100 | #13 | Exceptional 8.9% |
| Immigrants | Singapore | 100.0 /100 | #14 | Exceptional 8.9% |
| Bolivians | 100.0 /100 | #15 | Exceptional 8.9% |
| Immigrants | Korea | 100.0 /100 | #16 | Exceptional 9.0% |
| Burmese | 100.0 /100 | #17 | Exceptional 9.2% |
| Soviet Union | 100.0 /100 | #18 | Exceptional 9.2% |
| Immigrants | Venezuela | 100.0 /100 | #19 | Exceptional 9.3% |
| Immigrants | Argentina | 100.0 /100 | #20 | Exceptional 9.3% |
| Okinawans | 100.0 /100 | #21 | Exceptional 9.4% |
| Cypriots | 100.0 /100 | #22 | Exceptional 9.4% |