Sri Lankan vs Cape Verdean Disability Age Under 5
COMPARE
Sri Lankan
Cape Verdean
Disability Age Under 5
Disability Age Under 5 Comparison
Sri Lankans
Cape Verdeans
1.1%
DISABILITY AGE UNDER 5
96.8/ 100
METRIC RATING
94th/ 347
METRIC RANK
1.7%
DISABILITY AGE UNDER 5
0.0/ 100
METRIC RATING
309th/ 347
METRIC RANK
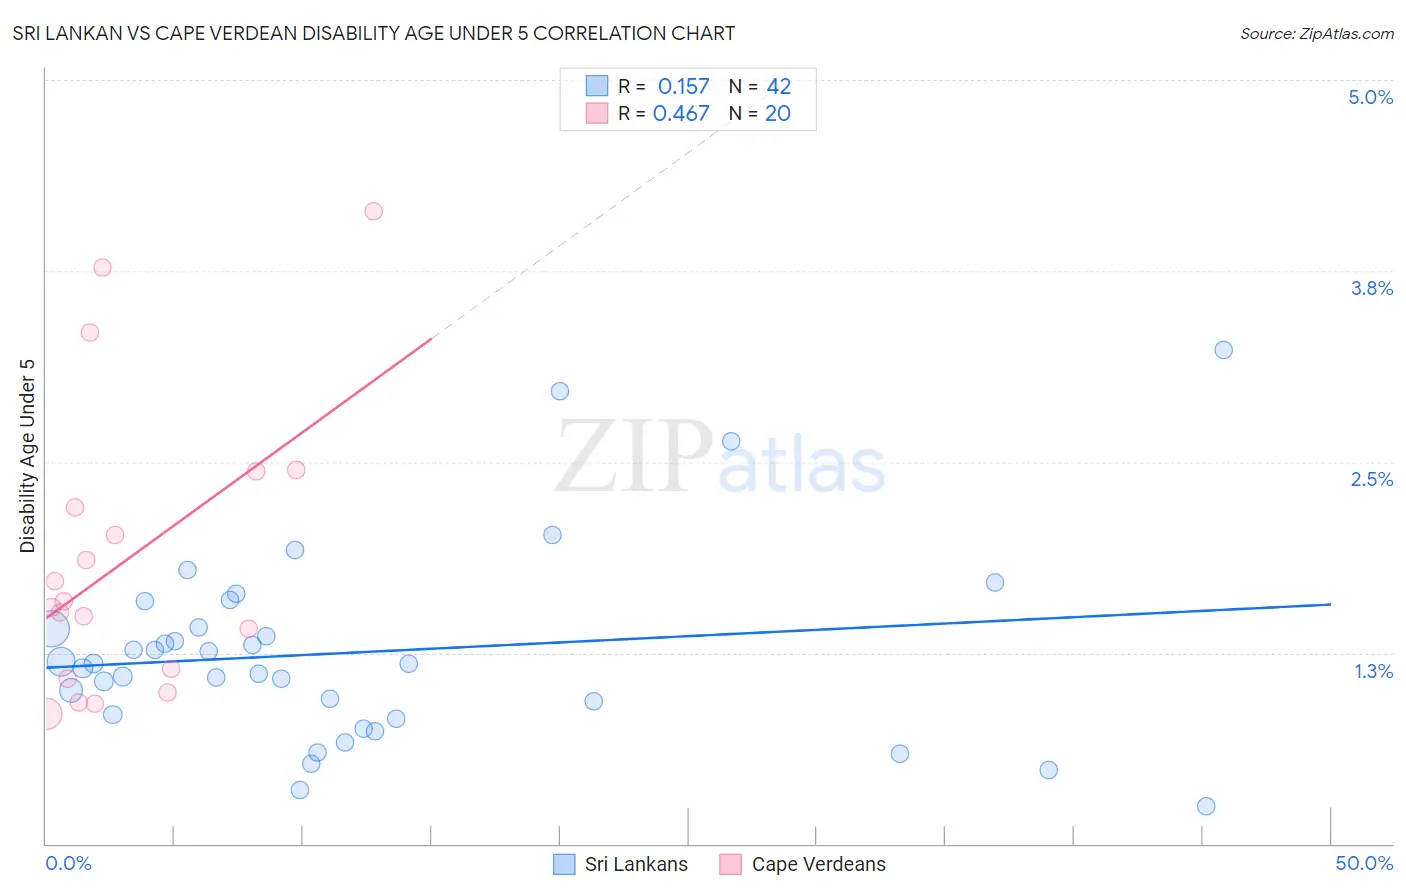
Sri Lankan vs Cape Verdean Disability Age Under 5 Correlation Chart
The statistical analysis conducted on geographies consisting of 232,959,648 people shows a poor positive correlation between the proportion of Sri Lankans and percentage of population with a disability under the age of 5 in the United States with a correlation coefficient (R) of 0.157 and weighted average of 1.1%. Similarly, the statistical analysis conducted on geographies consisting of 80,346,766 people shows a moderate positive correlation between the proportion of Cape Verdeans and percentage of population with a disability under the age of 5 in the United States with a correlation coefficient (R) of 0.467 and weighted average of 1.7%, a difference of 45.1%.
Disability Age Under 5 Correlation Summary
| Measurement | Sri Lankan | Cape Verdean |
| Minimum | 0.25% | 0.85% |
| Maximum | 3.2% | 4.1% |
| Range | 3.0% | 3.3% |
| Mean | 1.3% | 1.9% |
| Median | 1.2% | 1.6% |
| Interquartile 25% (IQ1) | 0.84% | 1.1% |
| Interquartile 75% (IQ3) | 1.4% | 2.3% |
| Interquartile Range (IQR) | 0.57% | 1.2% |
| Standard Deviation (Sample) | 0.63% | 0.95% |
| Standard Deviation (Population) | 0.62% | 0.93% |
Similar Demographics by Disability Age Under 5
Demographics Similar to Sri Lankans by Disability Age Under 5
In terms of disability age under 5, the demographic groups most similar to Sri Lankans are Immigrants from Moldova (1.1%, a difference of 0.050%), Spanish American (1.1%, a difference of 0.060%), Immigrants from Cuba (1.1%, a difference of 0.090%), Mongolian (1.1%, a difference of 0.16%), and Albanian (1.1%, a difference of 0.26%).
| Demographics | Rating | Rank | Disability Age Under 5 |
| Ugandans | 97.5 /100 | #87 | Exceptional 1.1% |
| Immigrants | Dominican Republic | 97.5 /100 | #88 | Exceptional 1.1% |
| Ethiopians | 97.2 /100 | #89 | Exceptional 1.1% |
| Chinese | 97.2 /100 | #90 | Exceptional 1.1% |
| Albanians | 97.2 /100 | #91 | Exceptional 1.1% |
| Immigrants | Cuba | 97.0 /100 | #92 | Exceptional 1.1% |
| Spanish Americans | 96.9 /100 | #93 | Exceptional 1.1% |
| Sri Lankans | 96.8 /100 | #94 | Exceptional 1.1% |
| Immigrants | Moldova | 96.8 /100 | #95 | Exceptional 1.1% |
| Mongolians | 96.6 /100 | #96 | Exceptional 1.1% |
| Immigrants | Iraq | 96.5 /100 | #97 | Exceptional 1.1% |
| Immigrants | South Eastern Asia | 96.5 /100 | #98 | Exceptional 1.1% |
| Dominicans | 96.3 /100 | #99 | Exceptional 1.1% |
| Nicaraguans | 96.3 /100 | #100 | Exceptional 1.1% |
| Immigrants | Uganda | 96.1 /100 | #101 | Exceptional 1.1% |
Demographics Similar to Cape Verdeans by Disability Age Under 5
In terms of disability age under 5, the demographic groups most similar to Cape Verdeans are White/Caucasian (1.7%, a difference of 0.070%), Navajo (1.6%, a difference of 0.63%), English (1.7%, a difference of 0.66%), Puerto Rican (1.7%, a difference of 0.70%), and Scottish (1.6%, a difference of 0.77%).
| Demographics | Rating | Rank | Disability Age Under 5 |
| Welsh | 0.0 /100 | #302 | Tragic 1.6% |
| Swiss | 0.0 /100 | #303 | Tragic 1.6% |
| Seminole | 0.0 /100 | #304 | Tragic 1.6% |
| Blackfeet | 0.0 /100 | #305 | Tragic 1.6% |
| Creek | 0.0 /100 | #306 | Tragic 1.6% |
| Scottish | 0.0 /100 | #307 | Tragic 1.6% |
| Navajo | 0.0 /100 | #308 | Tragic 1.6% |
| Cape Verdeans | 0.0 /100 | #309 | Tragic 1.7% |
| Whites/Caucasians | 0.0 /100 | #310 | Tragic 1.7% |
| English | 0.0 /100 | #311 | Tragic 1.7% |
| Puerto Ricans | 0.0 /100 | #312 | Tragic 1.7% |
| Celtics | 0.0 /100 | #313 | Tragic 1.7% |
| Norwegians | 0.0 /100 | #314 | Tragic 1.7% |
| Dutch | 0.0 /100 | #315 | Tragic 1.7% |
| Immigrants | Cabo Verde | 0.0 /100 | #316 | Tragic 1.7% |