Spanish vs Immigrants from Cuba Disability Age 18 to 34
COMPARE
Spanish
Immigrants from Cuba
Disability Age 18 to 34
Disability Age 18 to 34 Comparison
Spanish
Immigrants from Cuba
7.5%
DISABILITY AGE 18 TO 34
0.0/ 100
METRIC RATING
282nd/ 347
METRIC RANK
5.4%
DISABILITY AGE 18 TO 34
100.0/ 100
METRIC RATING
4th/ 347
METRIC RANK
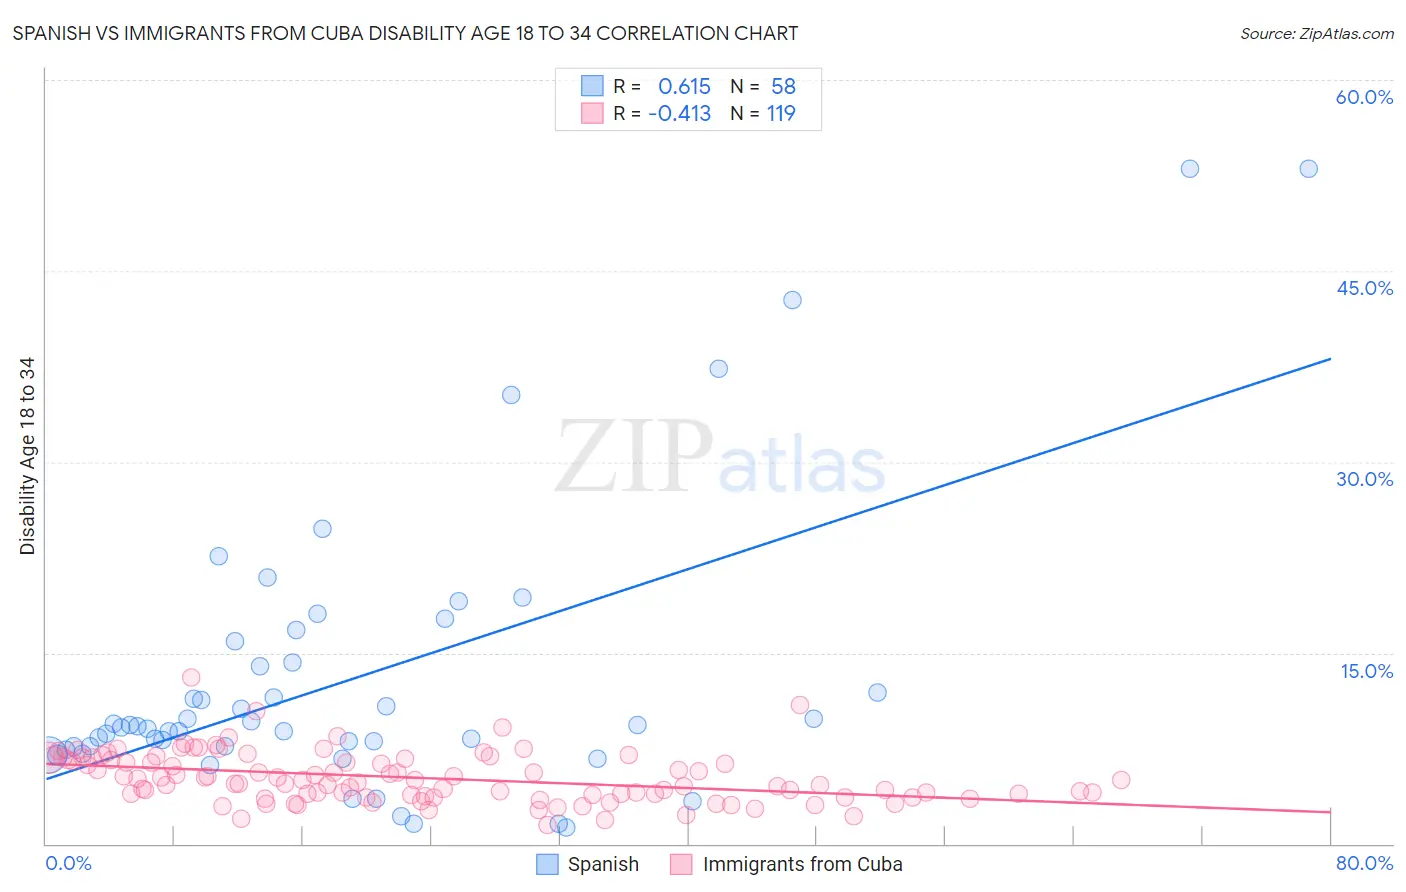
Spanish vs Immigrants from Cuba Disability Age 18 to 34 Correlation Chart
The statistical analysis conducted on geographies consisting of 420,890,896 people shows a significant positive correlation between the proportion of Spanish and percentage of population with a disability between the ages 18 and 35 in the United States with a correlation coefficient (R) of 0.615 and weighted average of 7.5%. Similarly, the statistical analysis conducted on geographies consisting of 325,387,969 people shows a moderate negative correlation between the proportion of Immigrants from Cuba and percentage of population with a disability between the ages 18 and 35 in the United States with a correlation coefficient (R) of -0.413 and weighted average of 5.4%, a difference of 39.7%.
Disability Age 18 to 34 Correlation Summary
| Measurement | Spanish | Immigrants from Cuba |
| Minimum | 1.3% | 1.5% |
| Maximum | 53.1% | 13.1% |
| Range | 51.8% | 11.6% |
| Mean | 12.9% | 5.2% |
| Median | 9.2% | 5.0% |
| Interquartile 25% (IQ1) | 7.6% | 3.8% |
| Interquartile 75% (IQ3) | 14.2% | 6.7% |
| Interquartile Range (IQR) | 6.6% | 2.8% |
| Standard Deviation (Sample) | 11.2% | 2.0% |
| Standard Deviation (Population) | 11.1% | 1.9% |
Similar Demographics by Disability Age 18 to 34
Demographics Similar to Spanish by Disability Age 18 to 34
In terms of disability age 18 to 34, the demographic groups most similar to Spanish are Danish (7.5%, a difference of 0.10%), Paiute (7.5%, a difference of 0.20%), Hopi (7.5%, a difference of 0.24%), Swedish (7.5%, a difference of 0.66%), and Czechoslovakian (7.4%, a difference of 0.69%).
| Demographics | Rating | Rank | Disability Age 18 to 34 |
| Immigrants | Somalia | 0.1 /100 | #275 | Tragic 7.4% |
| Europeans | 0.1 /100 | #276 | Tragic 7.4% |
| Immigrants | Portugal | 0.1 /100 | #277 | Tragic 7.4% |
| Lumbee | 0.1 /100 | #278 | Tragic 7.4% |
| Czechoslovakians | 0.1 /100 | #279 | Tragic 7.4% |
| Yaqui | 0.1 /100 | #280 | Tragic 7.4% |
| Paiute | 0.0 /100 | #281 | Tragic 7.5% |
| Spanish | 0.0 /100 | #282 | Tragic 7.5% |
| Danes | 0.0 /100 | #283 | Tragic 7.5% |
| Hopi | 0.0 /100 | #284 | Tragic 7.5% |
| Swedes | 0.0 /100 | #285 | Tragic 7.5% |
| Celtics | 0.0 /100 | #286 | Tragic 7.6% |
| Norwegians | 0.0 /100 | #287 | Tragic 7.6% |
| Whites/Caucasians | 0.0 /100 | #288 | Tragic 7.6% |
| Immigrants | Nonimmigrants | 0.0 /100 | #289 | Tragic 7.6% |
Demographics Similar to Immigrants from Cuba by Disability Age 18 to 34
In terms of disability age 18 to 34, the demographic groups most similar to Immigrants from Cuba are Immigrants from Taiwan (5.4%, a difference of 0.28%), Immigrants from Grenada (5.3%, a difference of 0.65%), Filipino (5.4%, a difference of 1.5%), Immigrants from China (5.4%, a difference of 1.6%), and Immigrants from Guyana (5.5%, a difference of 2.2%).
| Demographics | Rating | Rank | Disability Age 18 to 34 |
| Immigrants | Armenia | 100.0 /100 | #1 | Exceptional 5.0% |
| Immigrants | Hong Kong | 100.0 /100 | #2 | Exceptional 5.2% |
| Immigrants | Grenada | 100.0 /100 | #3 | Exceptional 5.3% |
| Immigrants | Cuba | 100.0 /100 | #4 | Exceptional 5.4% |
| Immigrants | Taiwan | 100.0 /100 | #5 | Exceptional 5.4% |
| Filipinos | 100.0 /100 | #6 | Exceptional 5.4% |
| Immigrants | China | 100.0 /100 | #7 | Exceptional 5.4% |
| Immigrants | Guyana | 100.0 /100 | #8 | Exceptional 5.5% |
| Guyanese | 100.0 /100 | #9 | Exceptional 5.5% |
| Immigrants | Uzbekistan | 100.0 /100 | #10 | Exceptional 5.5% |
| Vietnamese | 100.0 /100 | #11 | Exceptional 5.5% |
| Immigrants | St. Vincent and the Grenadines | 100.0 /100 | #12 | Exceptional 5.5% |
| Immigrants | Iran | 100.0 /100 | #13 | Exceptional 5.5% |
| Indians (Asian) | 100.0 /100 | #14 | Exceptional 5.5% |
| Immigrants | India | 100.0 /100 | #15 | Exceptional 5.6% |