Spanish vs Welsh Disability Age 18 to 34
COMPARE
Spanish
Welsh
Disability Age 18 to 34
Disability Age 18 to 34 Comparison
Spanish
Welsh
7.5%
DISABILITY AGE 18 TO 34
0.0/ 100
METRIC RATING
282nd/ 347
METRIC RANK
7.7%
DISABILITY AGE 18 TO 34
0.0/ 100
METRIC RATING
302nd/ 347
METRIC RANK
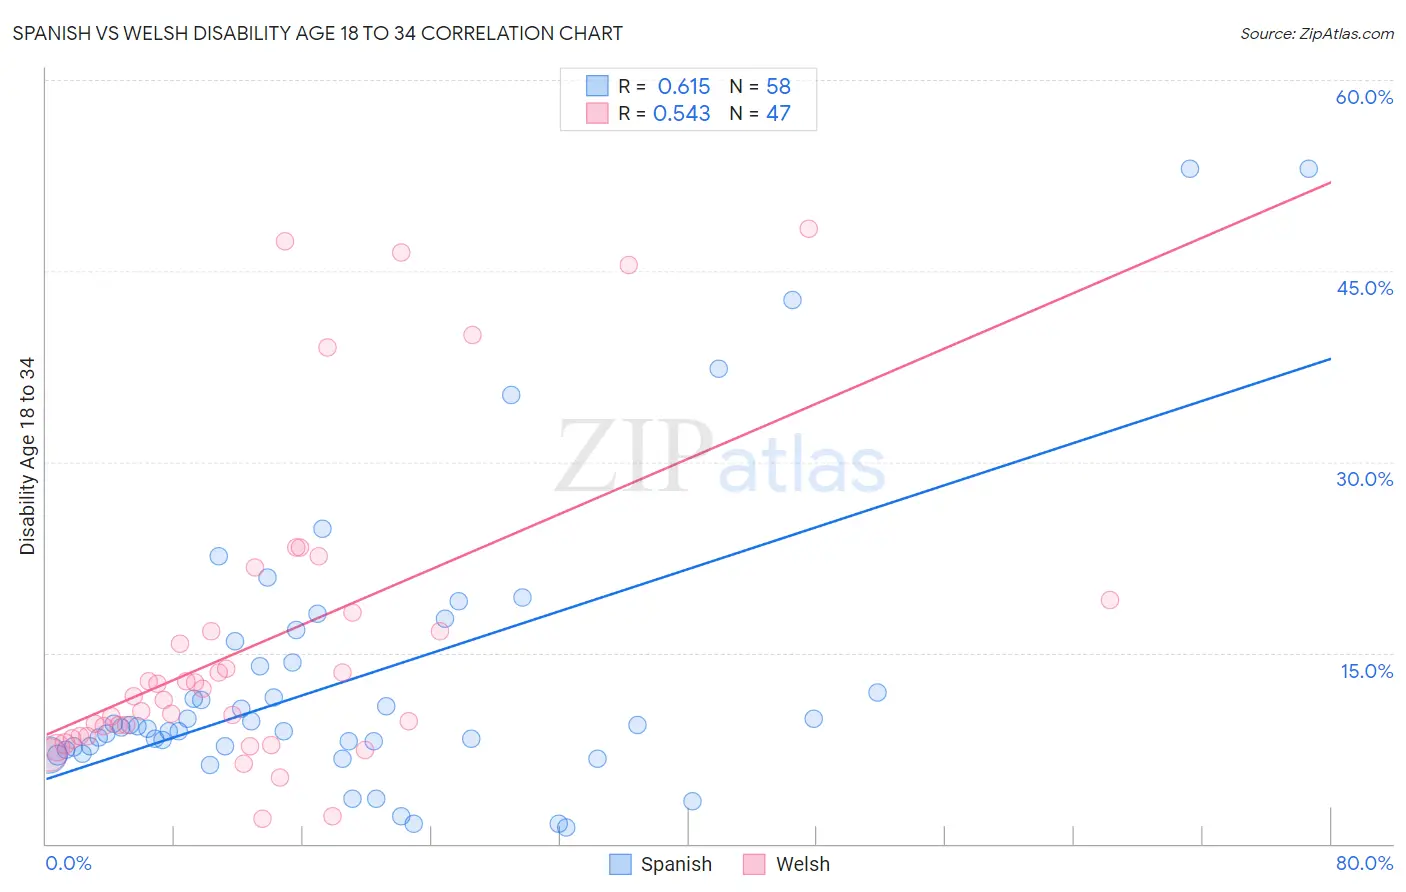
Spanish vs Welsh Disability Age 18 to 34 Correlation Chart
The statistical analysis conducted on geographies consisting of 420,890,896 people shows a significant positive correlation between the proportion of Spanish and percentage of population with a disability between the ages 18 and 35 in the United States with a correlation coefficient (R) of 0.615 and weighted average of 7.5%. Similarly, the statistical analysis conducted on geographies consisting of 524,899,929 people shows a substantial positive correlation between the proportion of Welsh and percentage of population with a disability between the ages 18 and 35 in the United States with a correlation coefficient (R) of 0.543 and weighted average of 7.7%, a difference of 3.3%.
Disability Age 18 to 34 Correlation Summary
| Measurement | Spanish | Welsh |
| Minimum | 1.3% | 1.9% |
| Maximum | 53.1% | 48.3% |
| Range | 51.8% | 46.3% |
| Mean | 12.9% | 15.8% |
| Median | 9.2% | 11.6% |
| Interquartile 25% (IQ1) | 7.6% | 8.5% |
| Interquartile 75% (IQ3) | 14.2% | 18.2% |
| Interquartile Range (IQR) | 6.6% | 9.7% |
| Standard Deviation (Sample) | 11.2% | 12.2% |
| Standard Deviation (Population) | 11.1% | 12.0% |
Demographics Similar to Spanish and Welsh by Disability Age 18 to 34
In terms of disability age 18 to 34, the demographic groups most similar to Spanish are Danish (7.5%, a difference of 0.10%), Hopi (7.5%, a difference of 0.24%), Swedish (7.5%, a difference of 0.66%), Celtic (7.6%, a difference of 1.6%), and Norwegian (7.6%, a difference of 1.8%). Similarly, the demographic groups most similar to Welsh are Pima (7.7%, a difference of 0.070%), Scottish (7.7%, a difference of 0.14%), German (7.7%, a difference of 0.15%), Dutch (7.7%, a difference of 0.39%), and Pueblo (7.7%, a difference of 0.46%).
| Demographics | Rating | Rank | Disability Age 18 to 34 |
| Spanish | 0.0 /100 | #282 | Tragic 7.5% |
| Danes | 0.0 /100 | #283 | Tragic 7.5% |
| Hopi | 0.0 /100 | #284 | Tragic 7.5% |
| Swedes | 0.0 /100 | #285 | Tragic 7.5% |
| Celtics | 0.0 /100 | #286 | Tragic 7.6% |
| Norwegians | 0.0 /100 | #287 | Tragic 7.6% |
| Whites/Caucasians | 0.0 /100 | #288 | Tragic 7.6% |
| Immigrants | Nonimmigrants | 0.0 /100 | #289 | Tragic 7.6% |
| Slovaks | 0.0 /100 | #290 | Tragic 7.7% |
| Irish | 0.0 /100 | #291 | Tragic 7.7% |
| Blacks/African Americans | 0.0 /100 | #292 | Tragic 7.7% |
| Scandinavians | 0.0 /100 | #293 | Tragic 7.7% |
| Immigrants | Cabo Verde | 0.0 /100 | #294 | Tragic 7.7% |
| Tlingit-Haida | 0.0 /100 | #295 | Tragic 7.7% |
| Cape Verdeans | 0.0 /100 | #296 | Tragic 7.7% |
| Pueblo | 0.0 /100 | #297 | Tragic 7.7% |
| Dutch | 0.0 /100 | #298 | Tragic 7.7% |
| Germans | 0.0 /100 | #299 | Tragic 7.7% |
| Scottish | 0.0 /100 | #300 | Tragic 7.7% |
| Pima | 0.0 /100 | #301 | Tragic 7.7% |
| Welsh | 0.0 /100 | #302 | Tragic 7.7% |