Spanish vs Canadian Disability Age 18 to 34
COMPARE
Spanish
Canadian
Disability Age 18 to 34
Disability Age 18 to 34 Comparison
Spanish
Canadians
7.5%
DISABILITY AGE 18 TO 34
0.0/ 100
METRIC RATING
282nd/ 347
METRIC RANK
7.3%
DISABILITY AGE 18 TO 34
0.2/ 100
METRIC RATING
262nd/ 347
METRIC RANK
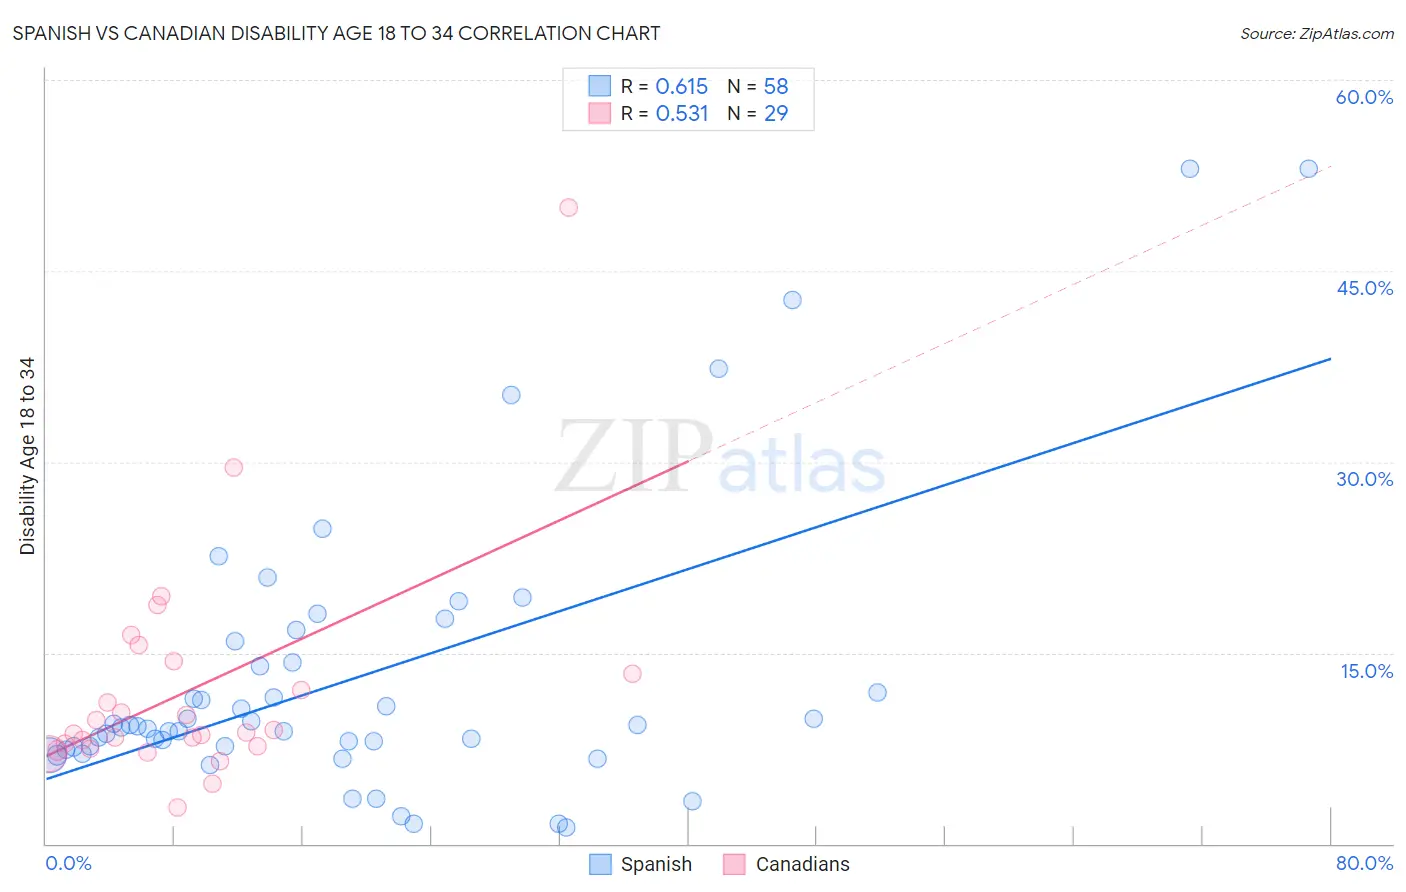
Spanish vs Canadian Disability Age 18 to 34 Correlation Chart
The statistical analysis conducted on geographies consisting of 420,890,896 people shows a significant positive correlation between the proportion of Spanish and percentage of population with a disability between the ages 18 and 35 in the United States with a correlation coefficient (R) of 0.615 and weighted average of 7.5%. Similarly, the statistical analysis conducted on geographies consisting of 436,030,339 people shows a substantial positive correlation between the proportion of Canadians and percentage of population with a disability between the ages 18 and 35 in the United States with a correlation coefficient (R) of 0.531 and weighted average of 7.3%, a difference of 2.5%.
Disability Age 18 to 34 Correlation Summary
| Measurement | Spanish | Canadian |
| Minimum | 1.3% | 2.8% |
| Maximum | 53.1% | 50.0% |
| Range | 51.8% | 47.2% |
| Mean | 12.9% | 12.0% |
| Median | 9.2% | 8.7% |
| Interquartile 25% (IQ1) | 7.6% | 7.6% |
| Interquartile 75% (IQ3) | 14.2% | 13.8% |
| Interquartile Range (IQR) | 6.6% | 6.3% |
| Standard Deviation (Sample) | 11.2% | 9.0% |
| Standard Deviation (Population) | 11.1% | 8.9% |
Demographics Similar to Spanish and Canadians by Disability Age 18 to 34
In terms of disability age 18 to 34, the demographic groups most similar to Spanish are Paiute (7.5%, a difference of 0.20%), Czechoslovakian (7.4%, a difference of 0.69%), Yaqui (7.4%, a difference of 0.69%), Lumbee (7.4%, a difference of 0.74%), and Immigrants from Portugal (7.4%, a difference of 0.76%). Similarly, the demographic groups most similar to Canadians are British (7.3%, a difference of 0.29%), Bermudan (7.3%, a difference of 0.55%), Slovene (7.3%, a difference of 0.57%), German Russian (7.4%, a difference of 0.74%), and Bangladeshi (7.4%, a difference of 0.80%).
| Demographics | Rating | Rank | Disability Age 18 to 34 |
| Canadians | 0.2 /100 | #262 | Tragic 7.3% |
| British | 0.2 /100 | #263 | Tragic 7.3% |
| Bermudans | 0.1 /100 | #264 | Tragic 7.3% |
| Slovenes | 0.1 /100 | #265 | Tragic 7.3% |
| German Russians | 0.1 /100 | #266 | Tragic 7.4% |
| Bangladeshis | 0.1 /100 | #267 | Tragic 7.4% |
| Portuguese | 0.1 /100 | #268 | Tragic 7.4% |
| Basques | 0.1 /100 | #269 | Tragic 7.4% |
| Belgians | 0.1 /100 | #270 | Tragic 7.4% |
| Swiss | 0.1 /100 | #271 | Tragic 7.4% |
| Tsimshian | 0.1 /100 | #272 | Tragic 7.4% |
| Slavs | 0.1 /100 | #273 | Tragic 7.4% |
| Africans | 0.1 /100 | #274 | Tragic 7.4% |
| Immigrants | Somalia | 0.1 /100 | #275 | Tragic 7.4% |
| Europeans | 0.1 /100 | #276 | Tragic 7.4% |
| Immigrants | Portugal | 0.1 /100 | #277 | Tragic 7.4% |
| Lumbee | 0.1 /100 | #278 | Tragic 7.4% |
| Czechoslovakians | 0.1 /100 | #279 | Tragic 7.4% |
| Yaqui | 0.1 /100 | #280 | Tragic 7.4% |
| Paiute | 0.0 /100 | #281 | Tragic 7.5% |
| Spanish | 0.0 /100 | #282 | Tragic 7.5% |