French vs Immigrants from Cuba Disability Age 18 to 34
COMPARE
French
Immigrants from Cuba
Disability Age 18 to 34
Disability Age 18 to 34 Comparison
French
Immigrants from Cuba
7.9%
DISABILITY AGE 18 TO 34
0.0/ 100
METRIC RATING
311th/ 347
METRIC RANK
5.4%
DISABILITY AGE 18 TO 34
100.0/ 100
METRIC RATING
4th/ 347
METRIC RANK
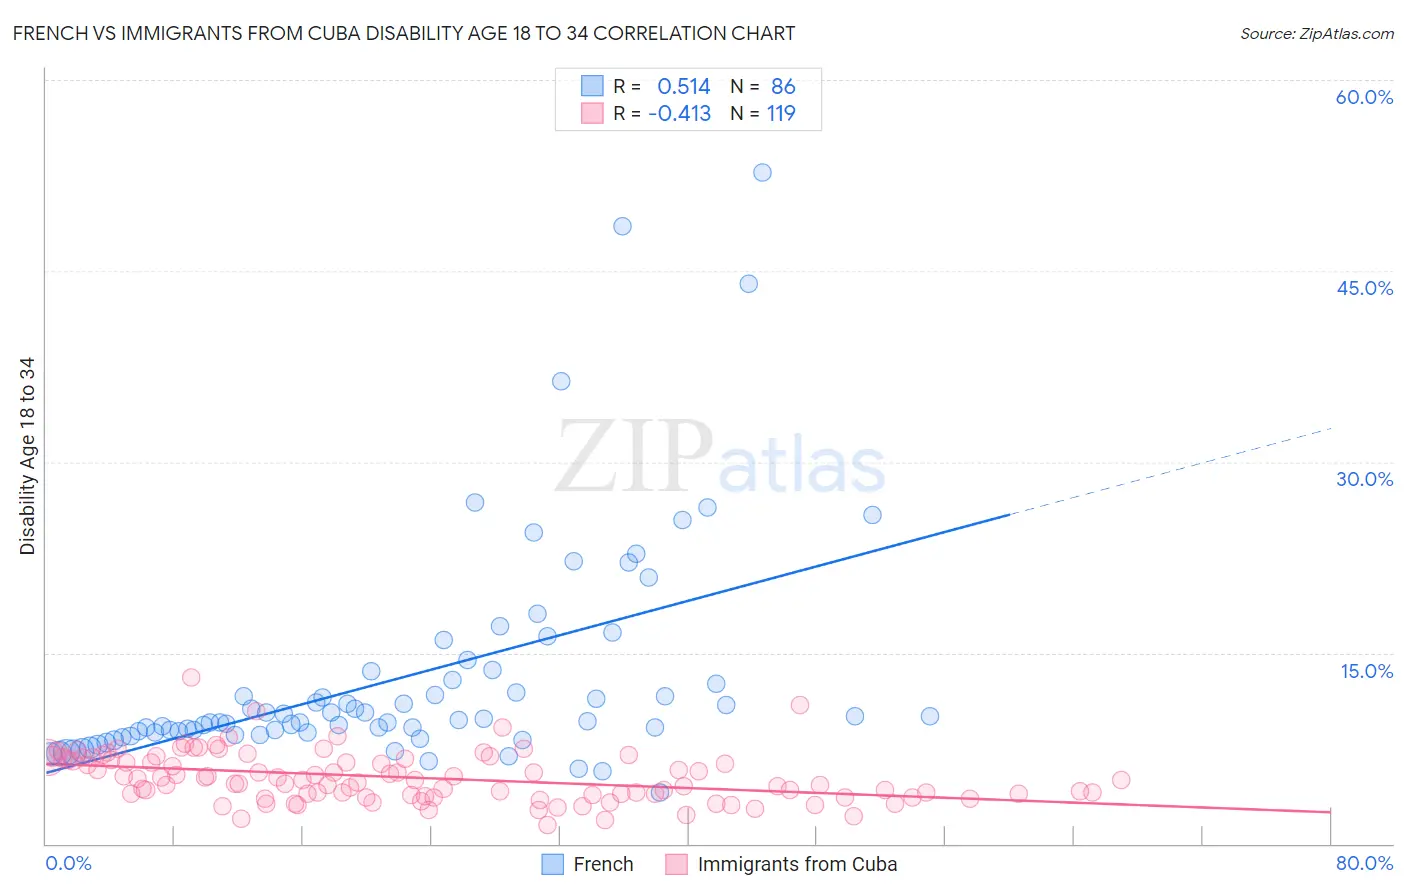
French vs Immigrants from Cuba Disability Age 18 to 34 Correlation Chart
The statistical analysis conducted on geographies consisting of 566,388,287 people shows a substantial positive correlation between the proportion of French and percentage of population with a disability between the ages 18 and 35 in the United States with a correlation coefficient (R) of 0.514 and weighted average of 7.9%. Similarly, the statistical analysis conducted on geographies consisting of 325,387,969 people shows a moderate negative correlation between the proportion of Immigrants from Cuba and percentage of population with a disability between the ages 18 and 35 in the United States with a correlation coefficient (R) of -0.413 and weighted average of 5.4%, a difference of 46.8%.
Disability Age 18 to 34 Correlation Summary
| Measurement | French | Immigrants from Cuba |
| Minimum | 4.0% | 1.5% |
| Maximum | 52.8% | 13.1% |
| Range | 48.7% | 11.6% |
| Mean | 13.0% | 5.2% |
| Median | 9.6% | 5.0% |
| Interquartile 25% (IQ1) | 8.7% | 3.8% |
| Interquartile 75% (IQ3) | 12.9% | 6.7% |
| Interquartile Range (IQR) | 4.1% | 2.8% |
| Standard Deviation (Sample) | 8.9% | 2.0% |
| Standard Deviation (Population) | 8.8% | 1.9% |
Similar Demographics by Disability Age 18 to 34
Demographics Similar to French by Disability Age 18 to 34
In terms of disability age 18 to 34, the demographic groups most similar to French are Spanish American (7.9%, a difference of 0.36%), Iroquois (7.9%, a difference of 0.40%), Finnish (7.8%, a difference of 0.75%), Alaska Native (7.8%, a difference of 0.81%), and Pennsylvania German (7.8%, a difference of 0.82%).
| Demographics | Rating | Rank | Disability Age 18 to 34 |
| Shoshone | 0.0 /100 | #304 | Tragic 7.8% |
| Menominee | 0.0 /100 | #305 | Tragic 7.8% |
| English | 0.0 /100 | #306 | Tragic 7.8% |
| Scotch-Irish | 0.0 /100 | #307 | Tragic 7.8% |
| Pennsylvania Germans | 0.0 /100 | #308 | Tragic 7.8% |
| Alaska Natives | 0.0 /100 | #309 | Tragic 7.8% |
| Finns | 0.0 /100 | #310 | Tragic 7.8% |
| French | 0.0 /100 | #311 | Tragic 7.9% |
| Spanish Americans | 0.0 /100 | #312 | Tragic 7.9% |
| Iroquois | 0.0 /100 | #313 | Tragic 7.9% |
| Colville | 0.0 /100 | #314 | Tragic 7.9% |
| Americans | 0.0 /100 | #315 | Tragic 8.0% |
| Puerto Ricans | 0.0 /100 | #316 | Tragic 8.0% |
| Hmong | 0.0 /100 | #317 | Tragic 8.1% |
| French Canadians | 0.0 /100 | #318 | Tragic 8.1% |
Demographics Similar to Immigrants from Cuba by Disability Age 18 to 34
In terms of disability age 18 to 34, the demographic groups most similar to Immigrants from Cuba are Immigrants from Taiwan (5.4%, a difference of 0.28%), Immigrants from Grenada (5.3%, a difference of 0.65%), Filipino (5.4%, a difference of 1.5%), Immigrants from China (5.4%, a difference of 1.6%), and Immigrants from Guyana (5.5%, a difference of 2.2%).
| Demographics | Rating | Rank | Disability Age 18 to 34 |
| Immigrants | Armenia | 100.0 /100 | #1 | Exceptional 5.0% |
| Immigrants | Hong Kong | 100.0 /100 | #2 | Exceptional 5.2% |
| Immigrants | Grenada | 100.0 /100 | #3 | Exceptional 5.3% |
| Immigrants | Cuba | 100.0 /100 | #4 | Exceptional 5.4% |
| Immigrants | Taiwan | 100.0 /100 | #5 | Exceptional 5.4% |
| Filipinos | 100.0 /100 | #6 | Exceptional 5.4% |
| Immigrants | China | 100.0 /100 | #7 | Exceptional 5.4% |
| Immigrants | Guyana | 100.0 /100 | #8 | Exceptional 5.5% |
| Guyanese | 100.0 /100 | #9 | Exceptional 5.5% |
| Immigrants | Uzbekistan | 100.0 /100 | #10 | Exceptional 5.5% |
| Vietnamese | 100.0 /100 | #11 | Exceptional 5.5% |
| Immigrants | St. Vincent and the Grenadines | 100.0 /100 | #12 | Exceptional 5.5% |
| Immigrants | Iran | 100.0 /100 | #13 | Exceptional 5.5% |
| Indians (Asian) | 100.0 /100 | #14 | Exceptional 5.5% |
| Immigrants | India | 100.0 /100 | #15 | Exceptional 5.6% |