Immigrants from Eastern Africa vs Immigrants from Cuba Disability Age 18 to 34
COMPARE
Immigrants from Eastern Africa
Immigrants from Cuba
Disability Age 18 to 34
Disability Age 18 to 34 Comparison
Immigrants from Eastern Africa
Immigrants from Cuba
6.7%
DISABILITY AGE 18 TO 34
33.2/ 100
METRIC RATING
191st/ 347
METRIC RANK
5.4%
DISABILITY AGE 18 TO 34
100.0/ 100
METRIC RATING
4th/ 347
METRIC RANK
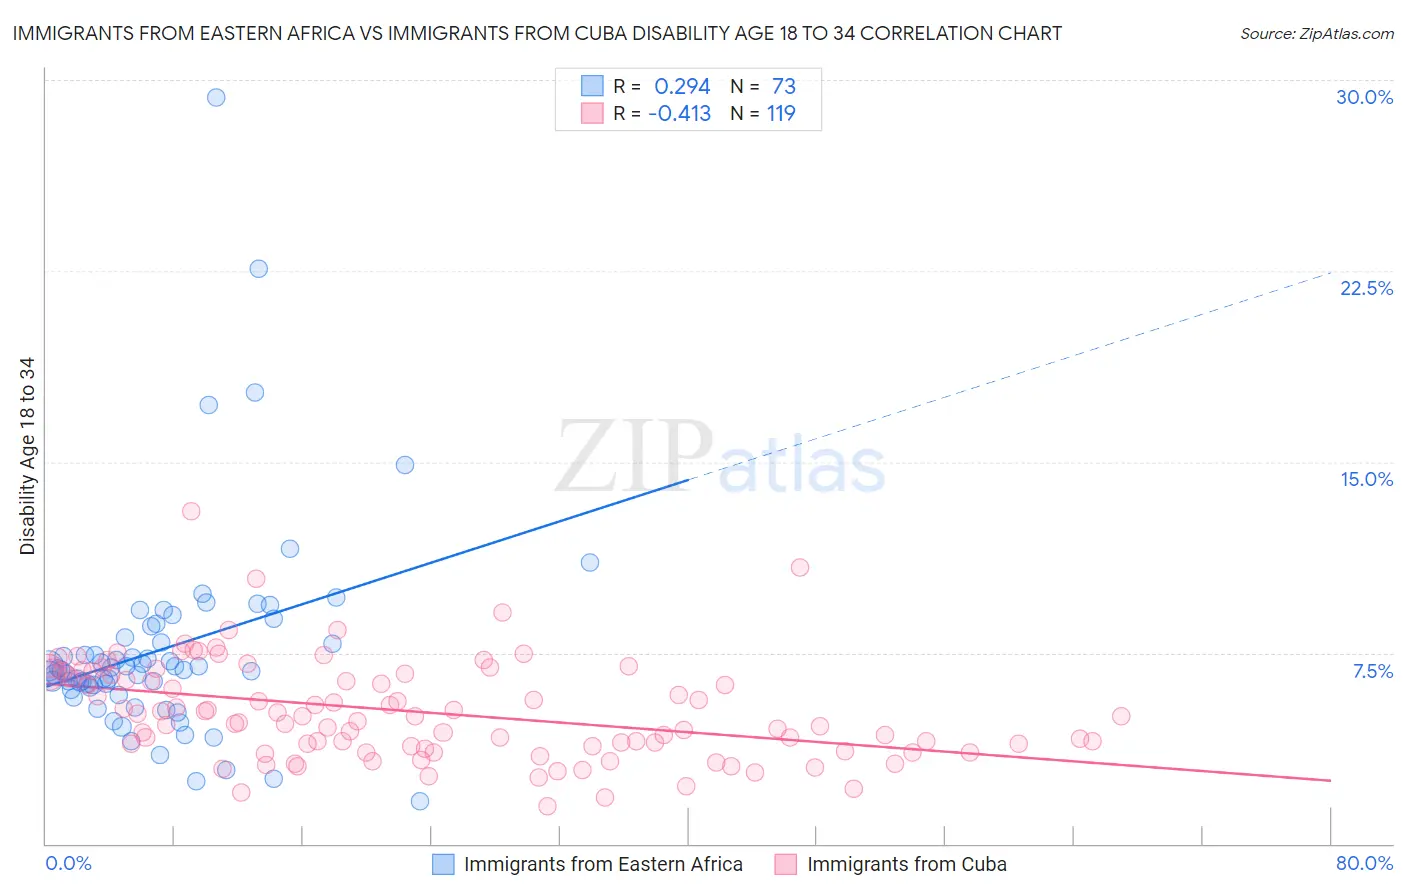
Immigrants from Eastern Africa vs Immigrants from Cuba Disability Age 18 to 34 Correlation Chart
The statistical analysis conducted on geographies consisting of 354,734,430 people shows a weak positive correlation between the proportion of Immigrants from Eastern Africa and percentage of population with a disability between the ages 18 and 35 in the United States with a correlation coefficient (R) of 0.294 and weighted average of 6.7%. Similarly, the statistical analysis conducted on geographies consisting of 325,387,969 people shows a moderate negative correlation between the proportion of Immigrants from Cuba and percentage of population with a disability between the ages 18 and 35 in the United States with a correlation coefficient (R) of -0.413 and weighted average of 5.4%, a difference of 24.5%.
Disability Age 18 to 34 Correlation Summary
| Measurement | Immigrants from Eastern Africa | Immigrants from Cuba |
| Minimum | 1.7% | 1.5% |
| Maximum | 29.3% | 13.1% |
| Range | 27.6% | 11.6% |
| Mean | 7.6% | 5.2% |
| Median | 6.8% | 5.0% |
| Interquartile 25% (IQ1) | 6.1% | 3.8% |
| Interquartile 75% (IQ3) | 8.3% | 6.7% |
| Interquartile Range (IQR) | 2.2% | 2.8% |
| Standard Deviation (Sample) | 4.2% | 2.0% |
| Standard Deviation (Population) | 4.1% | 1.9% |
Similar Demographics by Disability Age 18 to 34
Demographics Similar to Immigrants from Eastern Africa by Disability Age 18 to 34
In terms of disability age 18 to 34, the demographic groups most similar to Immigrants from Eastern Africa are Immigrants from Zimbabwe (6.7%, a difference of 0.030%), Pakistani (6.7%, a difference of 0.040%), Immigrants from Cameroon (6.7%, a difference of 0.10%), Maltese (6.7%, a difference of 0.13%), and Yup'ik (6.7%, a difference of 0.16%).
| Demographics | Rating | Rank | Disability Age 18 to 34 |
| Iraqis | 37.4 /100 | #184 | Fair 6.7% |
| Immigrants | Oceania | 35.4 /100 | #185 | Fair 6.7% |
| Yup'ik | 35.3 /100 | #186 | Fair 6.7% |
| Maltese | 34.8 /100 | #187 | Fair 6.7% |
| Immigrants | Cameroon | 34.5 /100 | #188 | Fair 6.7% |
| Pakistanis | 33.7 /100 | #189 | Fair 6.7% |
| Immigrants | Zimbabwe | 33.6 /100 | #190 | Fair 6.7% |
| Immigrants | Eastern Africa | 33.2 /100 | #191 | Fair 6.7% |
| Immigrants | Western Africa | 28.3 /100 | #192 | Fair 6.7% |
| Immigrants | Uganda | 25.1 /100 | #193 | Fair 6.7% |
| Immigrants | Sudan | 24.9 /100 | #194 | Fair 6.7% |
| Mexican American Indians | 22.3 /100 | #195 | Fair 6.7% |
| Immigrants | Netherlands | 21.0 /100 | #196 | Fair 6.7% |
| Estonians | 20.6 /100 | #197 | Fair 6.8% |
| Australians | 19.4 /100 | #198 | Poor 6.8% |
Demographics Similar to Immigrants from Cuba by Disability Age 18 to 34
In terms of disability age 18 to 34, the demographic groups most similar to Immigrants from Cuba are Immigrants from Taiwan (5.4%, a difference of 0.28%), Immigrants from Grenada (5.3%, a difference of 0.65%), Filipino (5.4%, a difference of 1.5%), Immigrants from China (5.4%, a difference of 1.6%), and Immigrants from Guyana (5.5%, a difference of 2.2%).
| Demographics | Rating | Rank | Disability Age 18 to 34 |
| Immigrants | Armenia | 100.0 /100 | #1 | Exceptional 5.0% |
| Immigrants | Hong Kong | 100.0 /100 | #2 | Exceptional 5.2% |
| Immigrants | Grenada | 100.0 /100 | #3 | Exceptional 5.3% |
| Immigrants | Cuba | 100.0 /100 | #4 | Exceptional 5.4% |
| Immigrants | Taiwan | 100.0 /100 | #5 | Exceptional 5.4% |
| Filipinos | 100.0 /100 | #6 | Exceptional 5.4% |
| Immigrants | China | 100.0 /100 | #7 | Exceptional 5.4% |
| Immigrants | Guyana | 100.0 /100 | #8 | Exceptional 5.5% |
| Guyanese | 100.0 /100 | #9 | Exceptional 5.5% |
| Immigrants | Uzbekistan | 100.0 /100 | #10 | Exceptional 5.5% |
| Vietnamese | 100.0 /100 | #11 | Exceptional 5.5% |
| Immigrants | St. Vincent and the Grenadines | 100.0 /100 | #12 | Exceptional 5.5% |
| Immigrants | Iran | 100.0 /100 | #13 | Exceptional 5.5% |
| Indians (Asian) | 100.0 /100 | #14 | Exceptional 5.5% |
| Immigrants | India | 100.0 /100 | #15 | Exceptional 5.6% |