Spanish American vs Immigrants from Oceania 7th Grade
COMPARE
Spanish American
Immigrants from Oceania
7th Grade
7th Grade Comparison
Spanish Americans
Immigrants from Oceania
95.7%
7TH GRADE
9.3/ 100
METRIC RATING
215th/ 347
METRIC RANK
95.7%
7TH GRADE
6.7/ 100
METRIC RATING
224th/ 347
METRIC RANK
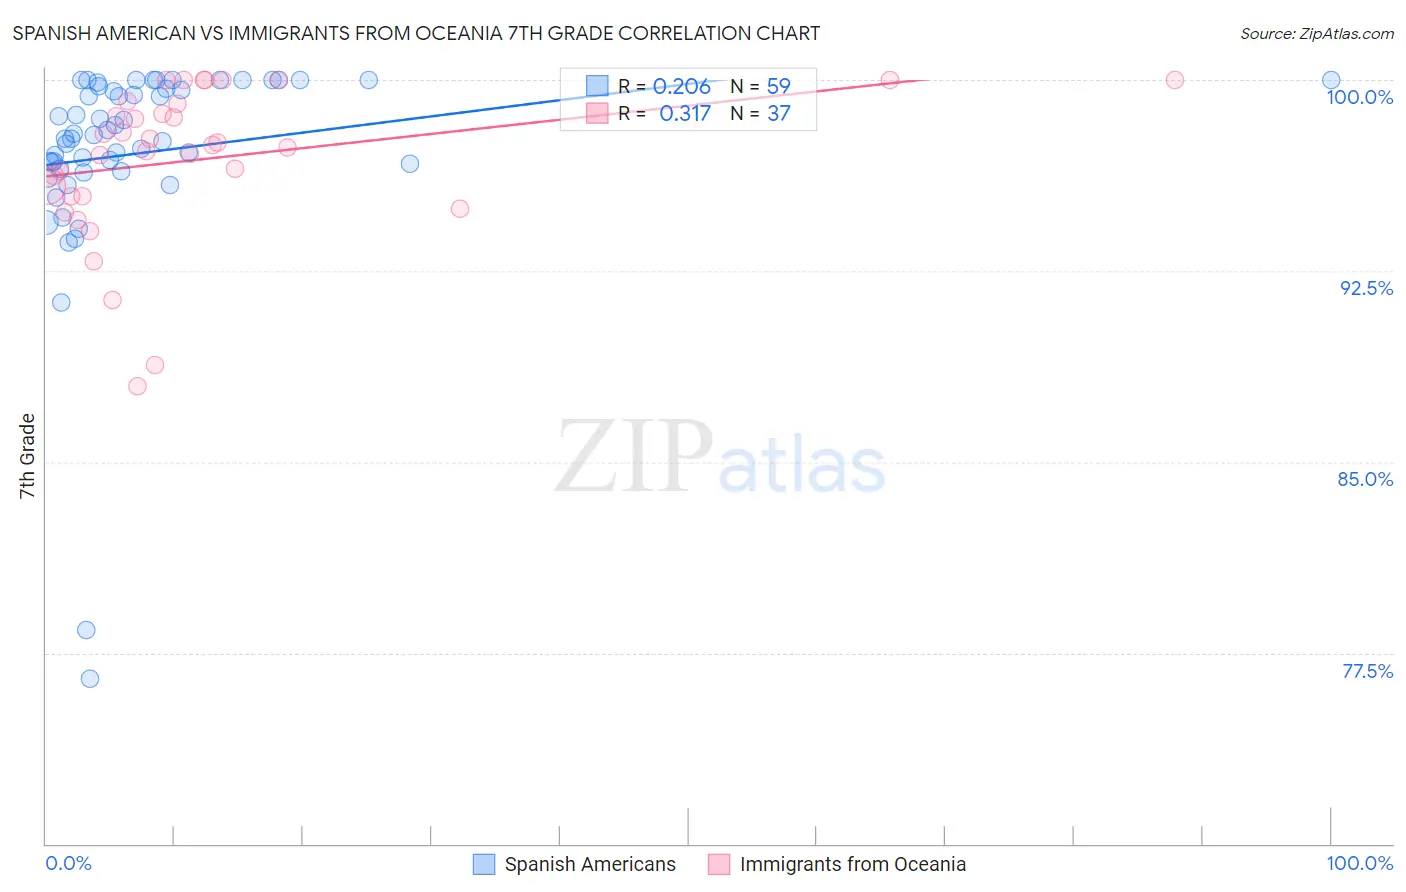
Spanish American vs Immigrants from Oceania 7th Grade Correlation Chart
The statistical analysis conducted on geographies consisting of 103,168,542 people shows a weak positive correlation between the proportion of Spanish Americans and percentage of population with at least 7th grade education in the United States with a correlation coefficient (R) of 0.206 and weighted average of 95.7%. Similarly, the statistical analysis conducted on geographies consisting of 305,521,521 people shows a mild positive correlation between the proportion of Immigrants from Oceania and percentage of population with at least 7th grade education in the United States with a correlation coefficient (R) of 0.317 and weighted average of 95.7%, a difference of 0.060%.
7th Grade Correlation Summary
| Measurement | Spanish American | Immigrants from Oceania |
| Minimum | 76.5% | 88.0% |
| Maximum | 100.0% | 100.0% |
| Range | 23.5% | 12.0% |
| Mean | 97.1% | 96.9% |
| Median | 97.8% | 97.5% |
| Interquartile 25% (IQ1) | 96.5% | 95.4% |
| Interquartile 75% (IQ3) | 99.8% | 99.1% |
| Interquartile Range (IQR) | 3.2% | 3.7% |
| Standard Deviation (Sample) | 4.2% | 3.0% |
| Standard Deviation (Population) | 4.2% | 3.0% |
Demographics Similar to Spanish Americans and Immigrants from Oceania by 7th Grade
In terms of 7th grade, the demographic groups most similar to Spanish Americans are Immigrants from Chile (95.7%, a difference of 0.0%), Immigrants from Pakistan (95.7%, a difference of 0.010%), Immigrants from Liberia (95.7%, a difference of 0.020%), Immigrants from Southern Europe (95.7%, a difference of 0.030%), and Bahamian (95.7%, a difference of 0.040%). Similarly, the demographic groups most similar to Immigrants from Oceania are Laotian (95.7%, a difference of 0.0%), Immigrants from Syria (95.7%, a difference of 0.0%), Subsaharan African (95.7%, a difference of 0.010%), Samoan (95.7%, a difference of 0.010%), and Immigrants from Malaysia (95.6%, a difference of 0.010%).
| Demographics | Rating | Rank | 7th Grade |
| Dutch West Indians | 16.1 /100 | #209 | Poor 95.8% |
| Hawaiians | 16.0 /100 | #210 | Poor 95.8% |
| Portuguese | 13.6 /100 | #211 | Poor 95.8% |
| Immigrants | Lebanon | 13.0 /100 | #212 | Poor 95.8% |
| Immigrants | Morocco | 12.6 /100 | #213 | Poor 95.8% |
| Bahamians | 11.6 /100 | #214 | Poor 95.7% |
| Spanish Americans | 9.3 /100 | #215 | Tragic 95.7% |
| Immigrants | Chile | 9.1 /100 | #216 | Tragic 95.7% |
| Immigrants | Pakistan | 9.0 /100 | #217 | Tragic 95.7% |
| Immigrants | Liberia | 8.1 /100 | #218 | Tragic 95.7% |
| Immigrants | Southern Europe | 7.9 /100 | #219 | Tragic 95.7% |
| Sub-Saharan Africans | 7.2 /100 | #220 | Tragic 95.7% |
| Samoans | 7.0 /100 | #221 | Tragic 95.7% |
| Laotians | 6.8 /100 | #222 | Tragic 95.7% |
| Immigrants | Syria | 6.7 /100 | #223 | Tragic 95.7% |
| Immigrants | Oceania | 6.7 /100 | #224 | Tragic 95.7% |
| Immigrants | Malaysia | 6.2 /100 | #225 | Tragic 95.6% |
| Immigrants | Eastern Asia | 5.8 /100 | #226 | Tragic 95.6% |
| Immigrants | Western Asia | 5.4 /100 | #227 | Tragic 95.6% |
| Immigrants | Eastern Africa | 5.1 /100 | #228 | Tragic 95.6% |
| Immigrants | Panama | 4.9 /100 | #229 | Tragic 95.6% |