Filipino vs Immigrants from Moldova Cognitive Disability
COMPARE
Filipino
Immigrants from Moldova
Cognitive Disability
Cognitive Disability Comparison
Filipinos
Immigrants from Moldova
16.4%
COGNITIVE DISABILITY
99.9/ 100
METRIC RATING
29th/ 347
METRIC RANK
16.7%
COGNITIVE DISABILITY
99.1/ 100
METRIC RATING
85th/ 347
METRIC RANK
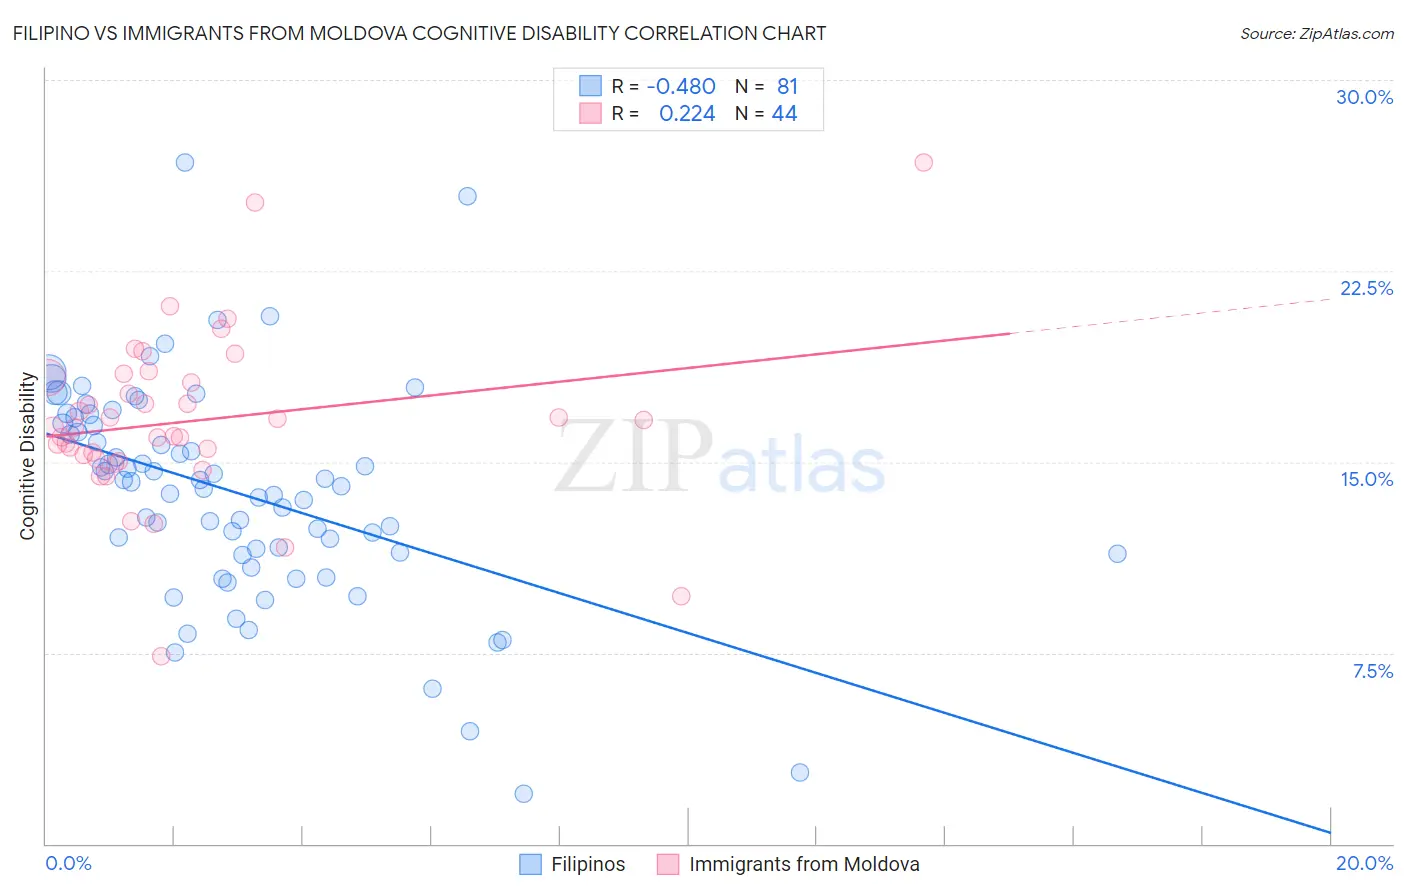
Filipino vs Immigrants from Moldova Cognitive Disability Correlation Chart
The statistical analysis conducted on geographies consisting of 254,348,780 people shows a moderate negative correlation between the proportion of Filipinos and percentage of population with cognitive disability in the United States with a correlation coefficient (R) of -0.480 and weighted average of 16.4%. Similarly, the statistical analysis conducted on geographies consisting of 124,376,689 people shows a weak positive correlation between the proportion of Immigrants from Moldova and percentage of population with cognitive disability in the United States with a correlation coefficient (R) of 0.224 and weighted average of 16.7%, a difference of 1.9%.
Cognitive Disability Correlation Summary
| Measurement | Filipino | Immigrants from Moldova |
| Minimum | 2.0% | 7.4% |
| Maximum | 26.8% | 26.8% |
| Range | 24.8% | 19.4% |
| Mean | 13.8% | 16.6% |
| Median | 14.2% | 16.4% |
| Interquartile 25% (IQ1) | 11.4% | 15.2% |
| Interquartile 75% (IQ3) | 16.6% | 18.2% |
| Interquartile Range (IQR) | 5.2% | 3.0% |
| Standard Deviation (Sample) | 4.3% | 3.4% |
| Standard Deviation (Population) | 4.2% | 3.3% |
Similar Demographics by Cognitive Disability
Demographics Similar to Filipinos by Cognitive Disability
In terms of cognitive disability, the demographic groups most similar to Filipinos are Czech (16.4%, a difference of 0.0%), Immigrants from Romania (16.4%, a difference of 0.020%), Immigrants from Pakistan (16.4%, a difference of 0.030%), Polish (16.4%, a difference of 0.030%), and Immigrants from Croatia (16.4%, a difference of 0.050%).
| Demographics | Rating | Rank | Cognitive Disability |
| Immigrants | South Central Asia | 99.9 /100 | #22 | Exceptional 16.4% |
| Croatians | 99.9 /100 | #23 | Exceptional 16.4% |
| Immigrants | Argentina | 99.9 /100 | #24 | Exceptional 16.4% |
| Luxembourgers | 99.9 /100 | #25 | Exceptional 16.4% |
| Immigrants | Croatia | 99.9 /100 | #26 | Exceptional 16.4% |
| Immigrants | Pakistan | 99.9 /100 | #27 | Exceptional 16.4% |
| Poles | 99.9 /100 | #28 | Exceptional 16.4% |
| Filipinos | 99.9 /100 | #29 | Exceptional 16.4% |
| Czechs | 99.9 /100 | #30 | Exceptional 16.4% |
| Immigrants | Romania | 99.9 /100 | #31 | Exceptional 16.4% |
| Immigrants | Israel | 99.9 /100 | #32 | Exceptional 16.4% |
| Italians | 99.9 /100 | #33 | Exceptional 16.4% |
| Russians | 99.9 /100 | #34 | Exceptional 16.4% |
| Slovaks | 99.9 /100 | #35 | Exceptional 16.4% |
| Greeks | 99.9 /100 | #36 | Exceptional 16.4% |
Demographics Similar to Immigrants from Moldova by Cognitive Disability
In terms of cognitive disability, the demographic groups most similar to Immigrants from Moldova are Belgian (16.7%, a difference of 0.020%), Serbian (16.7%, a difference of 0.030%), Immigrants from South Africa (16.7%, a difference of 0.030%), Native Hawaiian (16.7%, a difference of 0.050%), and Swiss (16.7%, a difference of 0.10%).
| Demographics | Rating | Rank | Cognitive Disability |
| Peruvians | 99.3 /100 | #78 | Exceptional 16.7% |
| Immigrants | Bulgaria | 99.3 /100 | #79 | Exceptional 16.7% |
| Egyptians | 99.2 /100 | #80 | Exceptional 16.7% |
| Immigrants | Netherlands | 99.2 /100 | #81 | Exceptional 16.7% |
| Swiss | 99.2 /100 | #82 | Exceptional 16.7% |
| Serbians | 99.1 /100 | #83 | Exceptional 16.7% |
| Belgians | 99.1 /100 | #84 | Exceptional 16.7% |
| Immigrants | Moldova | 99.1 /100 | #85 | Exceptional 16.7% |
| Immigrants | South Africa | 99.0 /100 | #86 | Exceptional 16.7% |
| Native Hawaiians | 99.0 /100 | #87 | Exceptional 16.7% |
| Immigrants | Philippines | 99.0 /100 | #88 | Exceptional 16.7% |
| Immigrants | Egypt | 98.8 /100 | #89 | Exceptional 16.7% |
| South Americans | 98.8 /100 | #90 | Exceptional 16.7% |
| Danes | 98.8 /100 | #91 | Exceptional 16.7% |
| Immigrants | South America | 98.8 /100 | #92 | Exceptional 16.7% |