Spanish American Indian vs Czech Disability Age 18 to 34
COMPARE
Spanish American Indian
Czech
Disability Age 18 to 34
Disability Age 18 to 34 Comparison
Spanish American Indians
Czechs
6.4%
DISABILITY AGE 18 TO 34
87.7/ 100
METRIC RATING
138th/ 347
METRIC RANK
7.2%
DISABILITY AGE 18 TO 34
0.3/ 100
METRIC RATING
257th/ 347
METRIC RANK
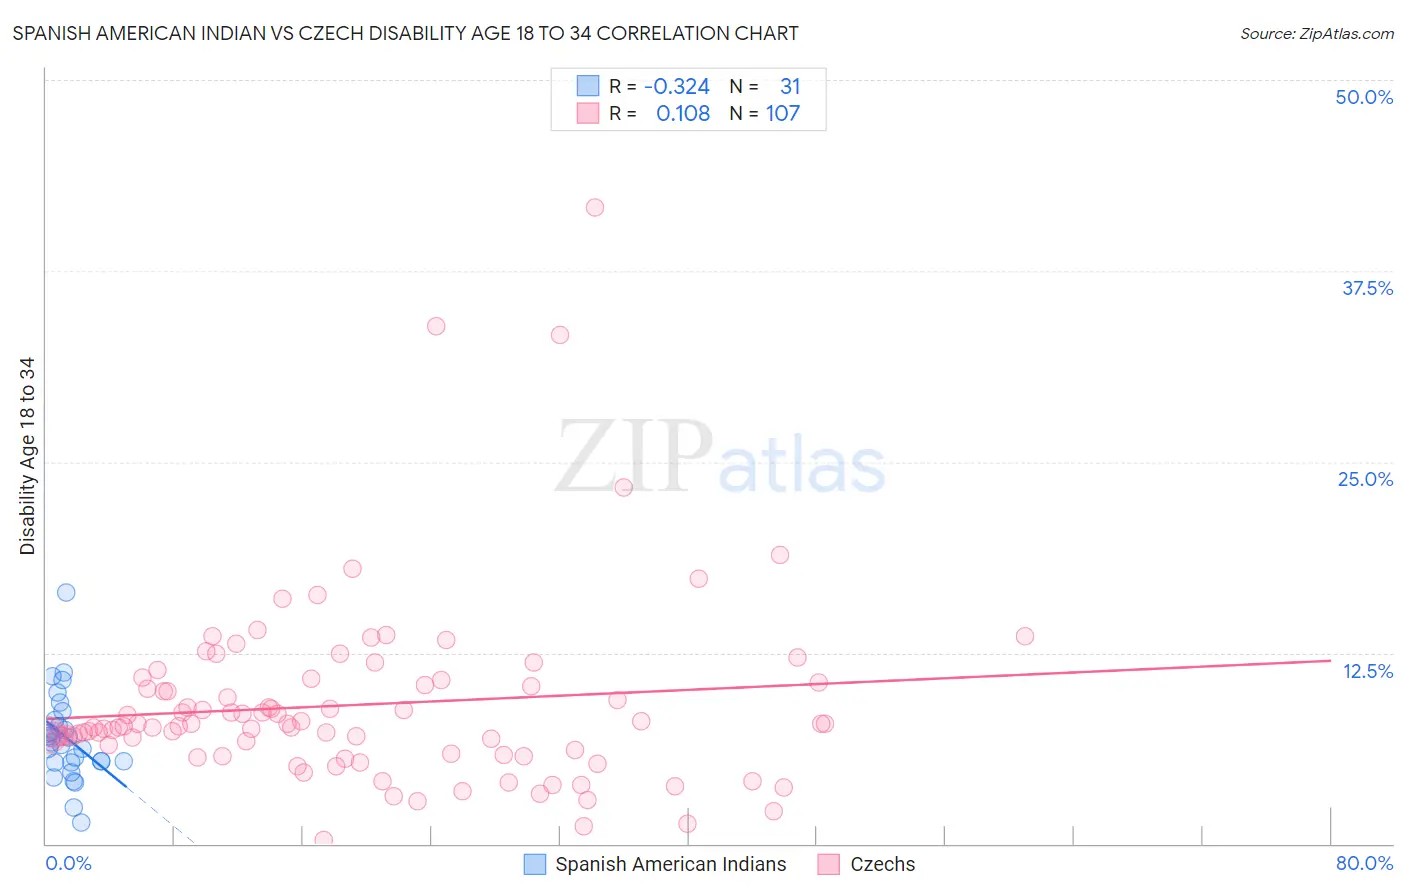
Spanish American Indian vs Czech Disability Age 18 to 34 Correlation Chart
The statistical analysis conducted on geographies consisting of 73,116,969 people shows a mild negative correlation between the proportion of Spanish American Indians and percentage of population with a disability between the ages 18 and 35 in the United States with a correlation coefficient (R) of -0.324 and weighted average of 6.4%. Similarly, the statistical analysis conducted on geographies consisting of 482,183,627 people shows a poor positive correlation between the proportion of Czechs and percentage of population with a disability between the ages 18 and 35 in the United States with a correlation coefficient (R) of 0.108 and weighted average of 7.2%, a difference of 13.8%.
Disability Age 18 to 34 Correlation Summary
| Measurement | Spanish American Indian | Czech |
| Minimum | 1.4% | 0.24% |
| Maximum | 16.4% | 41.7% |
| Range | 15.1% | 41.4% |
| Mean | 6.9% | 9.1% |
| Median | 6.6% | 7.7% |
| Interquartile 25% (IQ1) | 5.3% | 5.9% |
| Interquartile 75% (IQ3) | 8.1% | 10.6% |
| Interquartile Range (IQR) | 2.7% | 4.7% |
| Standard Deviation (Sample) | 2.9% | 6.1% |
| Standard Deviation (Population) | 2.9% | 6.0% |
Similar Demographics by Disability Age 18 to 34
Demographics Similar to Spanish American Indians by Disability Age 18 to 34
In terms of disability age 18 to 34, the demographic groups most similar to Spanish American Indians are Immigrants from Honduras (6.4%, a difference of 0.0%), Immigrants from Belize (6.4%, a difference of 0.050%), Immigrants from Fiji (6.4%, a difference of 0.070%), Immigrants from Sweden (6.4%, a difference of 0.13%), and Palestinian (6.4%, a difference of 0.14%).
| Demographics | Rating | Rank | Disability Age 18 to 34 |
| Immigrants | Saudi Arabia | 90.4 /100 | #131 | Exceptional 6.3% |
| Guatemalans | 89.6 /100 | #132 | Excellent 6.4% |
| Brazilians | 89.0 /100 | #133 | Excellent 6.4% |
| Immigrants | Europe | 88.8 /100 | #134 | Excellent 6.4% |
| Palestinians | 88.5 /100 | #135 | Excellent 6.4% |
| Immigrants | Sweden | 88.5 /100 | #136 | Excellent 6.4% |
| Immigrants | Honduras | 87.7 /100 | #137 | Excellent 6.4% |
| Spanish American Indians | 87.7 /100 | #138 | Excellent 6.4% |
| Immigrants | Belize | 87.4 /100 | #139 | Excellent 6.4% |
| Immigrants | Fiji | 87.3 /100 | #140 | Excellent 6.4% |
| Jamaicans | 86.8 /100 | #141 | Excellent 6.4% |
| South American Indians | 86.5 /100 | #142 | Excellent 6.4% |
| Immigrants | Latvia | 86.4 /100 | #143 | Excellent 6.4% |
| Albanians | 85.3 /100 | #144 | Excellent 6.4% |
| Moroccans | 85.2 /100 | #145 | Excellent 6.4% |
Demographics Similar to Czechs by Disability Age 18 to 34
In terms of disability age 18 to 34, the demographic groups most similar to Czechs are Immigrants from Laos (7.2%, a difference of 0.27%), Immigrants from Germany (7.2%, a difference of 0.30%), Indonesian (7.2%, a difference of 0.32%), Immigrants from Micronesia (7.3%, a difference of 0.44%), and Somali (7.3%, a difference of 0.51%).
| Demographics | Rating | Rank | Disability Age 18 to 34 |
| Fijians | 0.6 /100 | #250 | Tragic 7.2% |
| Spaniards | 0.6 /100 | #251 | Tragic 7.2% |
| Poles | 0.6 /100 | #252 | Tragic 7.2% |
| Croatians | 0.5 /100 | #253 | Tragic 7.2% |
| Indonesians | 0.4 /100 | #254 | Tragic 7.2% |
| Immigrants | Germany | 0.4 /100 | #255 | Tragic 7.2% |
| Immigrants | Laos | 0.4 /100 | #256 | Tragic 7.2% |
| Czechs | 0.3 /100 | #257 | Tragic 7.2% |
| Immigrants | Micronesia | 0.3 /100 | #258 | Tragic 7.3% |
| Somalis | 0.2 /100 | #259 | Tragic 7.3% |
| Tohono O'odham | 0.2 /100 | #260 | Tragic 7.3% |
| Northern Europeans | 0.2 /100 | #261 | Tragic 7.3% |
| Canadians | 0.2 /100 | #262 | Tragic 7.3% |
| British | 0.2 /100 | #263 | Tragic 7.3% |
| Bermudans | 0.1 /100 | #264 | Tragic 7.3% |