Sri Lankan vs Immigrants from Sierra Leone Disability Age 18 to 34
COMPARE
Sri Lankan
Immigrants from Sierra Leone
Disability Age 18 to 34
Disability Age 18 to 34 Comparison
Sri Lankans
Immigrants from Sierra Leone
6.2%
DISABILITY AGE 18 TO 34
95.5/ 100
METRIC RATING
109th/ 347
METRIC RANK
6.5%
DISABILITY AGE 18 TO 34
75.0/ 100
METRIC RATING
157th/ 347
METRIC RANK
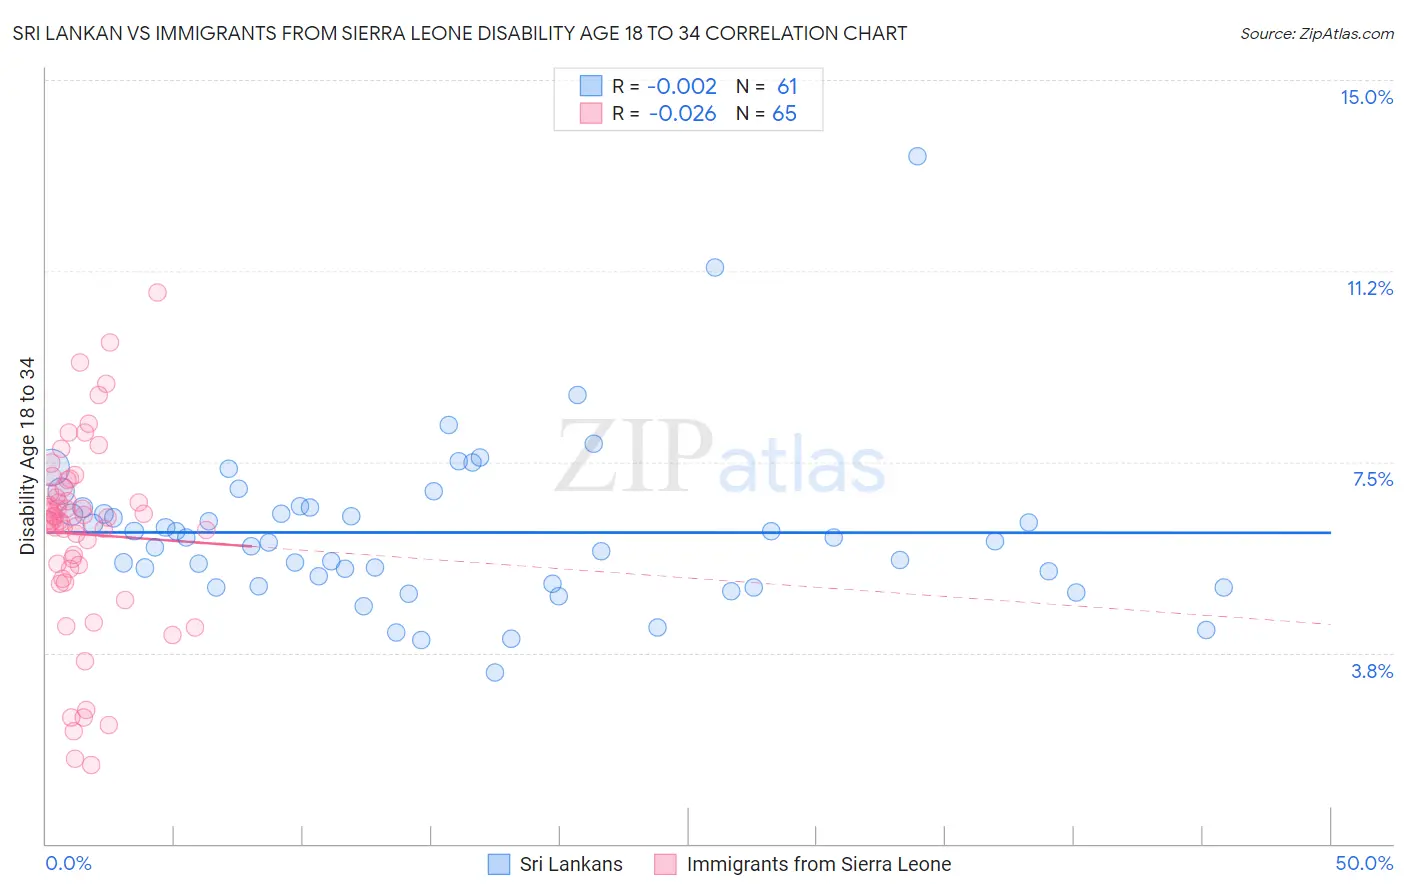
Sri Lankan vs Immigrants from Sierra Leone Disability Age 18 to 34 Correlation Chart
The statistical analysis conducted on geographies consisting of 439,694,606 people shows no correlation between the proportion of Sri Lankans and percentage of population with a disability between the ages 18 and 35 in the United States with a correlation coefficient (R) of -0.002 and weighted average of 6.2%. Similarly, the statistical analysis conducted on geographies consisting of 101,637,669 people shows no correlation between the proportion of Immigrants from Sierra Leone and percentage of population with a disability between the ages 18 and 35 in the United States with a correlation coefficient (R) of -0.026 and weighted average of 6.5%, a difference of 3.6%.
Disability Age 18 to 34 Correlation Summary
| Measurement | Sri Lankan | Immigrants from Sierra Leone |
| Minimum | 3.4% | 1.6% |
| Maximum | 13.5% | 10.8% |
| Range | 10.2% | 9.3% |
| Mean | 6.1% | 6.1% |
| Median | 5.9% | 6.4% |
| Interquartile 25% (IQ1) | 5.1% | 5.3% |
| Interquartile 75% (IQ3) | 6.6% | 6.9% |
| Interquartile Range (IQR) | 1.5% | 1.6% |
| Standard Deviation (Sample) | 1.6% | 1.9% |
| Standard Deviation (Population) | 1.6% | 1.9% |
Similar Demographics by Disability Age 18 to 34
Demographics Similar to Sri Lankans by Disability Age 18 to 34
In terms of disability age 18 to 34, the demographic groups most similar to Sri Lankans are Immigrants from Croatia (6.2%, a difference of 0.060%), Ethiopian (6.2%, a difference of 0.10%), Immigrants from Afghanistan (6.2%, a difference of 0.14%), Immigrants from Brazil (6.3%, a difference of 0.16%), and Immigrants from France (6.3%, a difference of 0.16%).
| Demographics | Rating | Rank | Disability Age 18 to 34 |
| Laotians | 96.4 /100 | #102 | Exceptional 6.2% |
| Immigrants | Bulgaria | 96.3 /100 | #103 | Exceptional 6.2% |
| Mongolians | 96.2 /100 | #104 | Exceptional 6.2% |
| Bhutanese | 96.2 /100 | #105 | Exceptional 6.2% |
| Immigrants | Afghanistan | 95.9 /100 | #106 | Exceptional 6.2% |
| Ethiopians | 95.8 /100 | #107 | Exceptional 6.2% |
| Immigrants | Croatia | 95.7 /100 | #108 | Exceptional 6.2% |
| Sri Lankans | 95.5 /100 | #109 | Exceptional 6.2% |
| Immigrants | Brazil | 95.2 /100 | #110 | Exceptional 6.3% |
| Immigrants | France | 95.1 /100 | #111 | Exceptional 6.3% |
| Immigrants | Romania | 94.9 /100 | #112 | Exceptional 6.3% |
| Immigrants | Latin America | 94.9 /100 | #113 | Exceptional 6.3% |
| Immigrants | South Eastern Asia | 94.4 /100 | #114 | Exceptional 6.3% |
| Koreans | 94.1 /100 | #115 | Exceptional 6.3% |
| Immigrants | Costa Rica | 94.0 /100 | #116 | Exceptional 6.3% |
Demographics Similar to Immigrants from Sierra Leone by Disability Age 18 to 34
In terms of disability age 18 to 34, the demographic groups most similar to Immigrants from Sierra Leone are Immigrants from Panama (6.5%, a difference of 0.030%), Zimbabwean (6.5%, a difference of 0.030%), Dominican (6.5%, a difference of 0.14%), Immigrants from Central America (6.5%, a difference of 0.17%), and Inupiat (6.5%, a difference of 0.17%).
| Demographics | Rating | Rank | Disability Age 18 to 34 |
| Immigrants | Dominican Republic | 82.7 /100 | #150 | Excellent 6.4% |
| Tongans | 81.9 /100 | #151 | Excellent 6.4% |
| Bulgarians | 78.3 /100 | #152 | Good 6.5% |
| Immigrants | Eritrea | 77.4 /100 | #153 | Good 6.5% |
| Immigrants | Central America | 76.8 /100 | #154 | Good 6.5% |
| Inupiat | 76.7 /100 | #155 | Good 6.5% |
| Immigrants | Panama | 75.3 /100 | #156 | Good 6.5% |
| Immigrants | Sierra Leone | 75.0 /100 | #157 | Good 6.5% |
| Zimbabweans | 74.7 /100 | #158 | Good 6.5% |
| Dominicans | 73.6 /100 | #159 | Good 6.5% |
| Immigrants | Southern Europe | 72.5 /100 | #160 | Good 6.5% |
| Arabs | 72.3 /100 | #161 | Good 6.5% |
| South Africans | 71.7 /100 | #162 | Good 6.5% |
| Immigrants | Denmark | 71.7 /100 | #163 | Good 6.5% |
| Immigrants | Nigeria | 70.4 /100 | #164 | Good 6.5% |