Haitian vs Immigrants from Sierra Leone Disability Age 18 to 34
COMPARE
Haitian
Immigrants from Sierra Leone
Disability Age 18 to 34
Disability Age 18 to 34 Comparison
Haitians
Immigrants from Sierra Leone
6.0%
DISABILITY AGE 18 TO 34
99.2/ 100
METRIC RATING
74th/ 347
METRIC RANK
6.5%
DISABILITY AGE 18 TO 34
75.0/ 100
METRIC RATING
157th/ 347
METRIC RANK
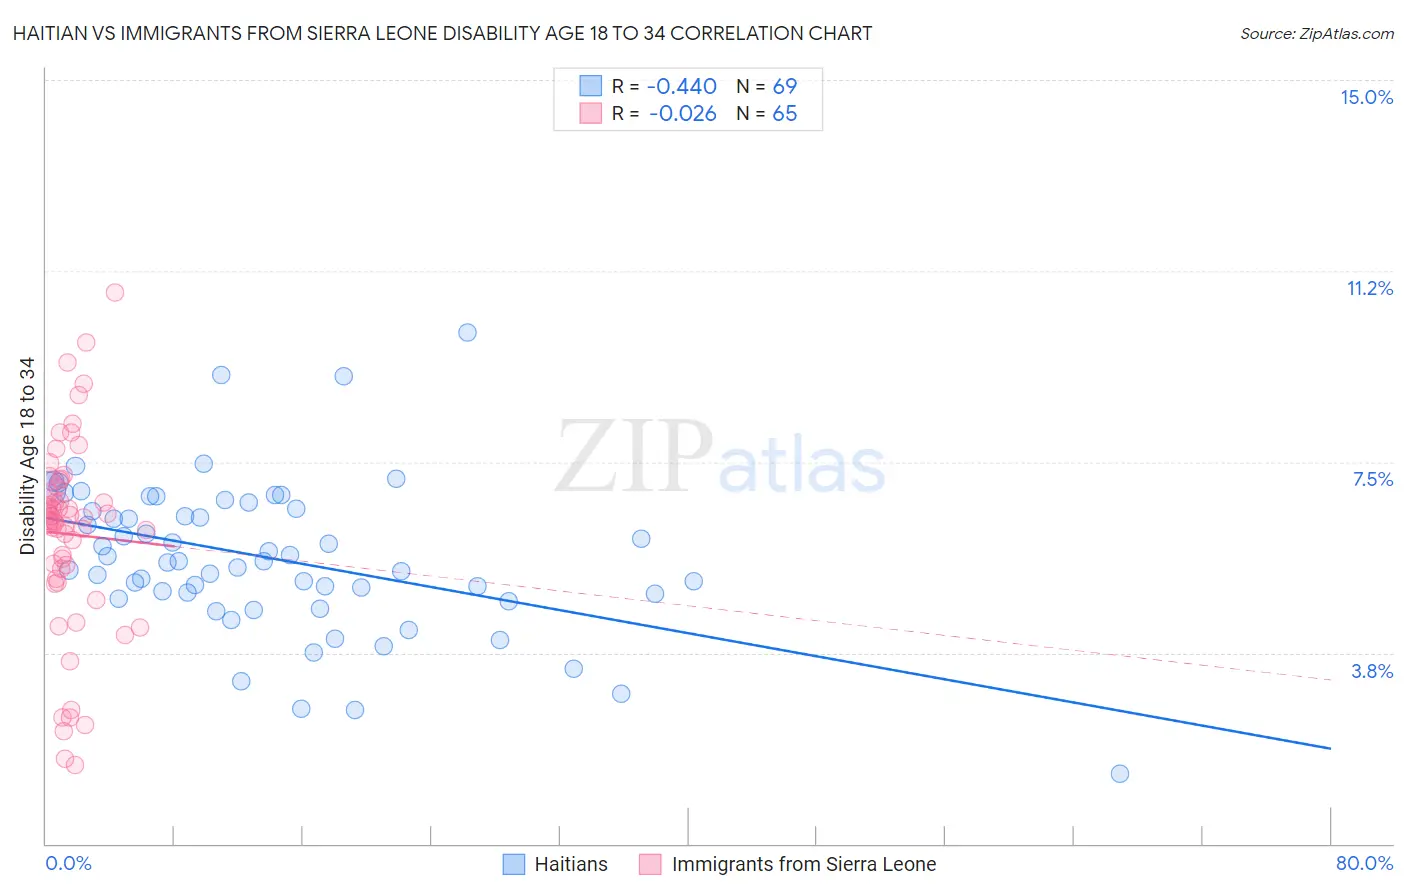
Haitian vs Immigrants from Sierra Leone Disability Age 18 to 34 Correlation Chart
The statistical analysis conducted on geographies consisting of 287,604,782 people shows a moderate negative correlation between the proportion of Haitians and percentage of population with a disability between the ages 18 and 35 in the United States with a correlation coefficient (R) of -0.440 and weighted average of 6.0%. Similarly, the statistical analysis conducted on geographies consisting of 101,637,669 people shows no correlation between the proportion of Immigrants from Sierra Leone and percentage of population with a disability between the ages 18 and 35 in the United States with a correlation coefficient (R) of -0.026 and weighted average of 6.5%, a difference of 7.0%.
Disability Age 18 to 34 Correlation Summary
| Measurement | Haitian | Immigrants from Sierra Leone |
| Minimum | 1.4% | 1.6% |
| Maximum | 10.0% | 10.8% |
| Range | 8.7% | 9.3% |
| Mean | 5.6% | 6.1% |
| Median | 5.5% | 6.4% |
| Interquartile 25% (IQ1) | 4.9% | 5.3% |
| Interquartile 75% (IQ3) | 6.6% | 6.9% |
| Interquartile Range (IQR) | 1.8% | 1.6% |
| Standard Deviation (Sample) | 1.5% | 1.9% |
| Standard Deviation (Population) | 1.5% | 1.9% |
Similar Demographics by Disability Age 18 to 34
Demographics Similar to Haitians by Disability Age 18 to 34
In terms of disability age 18 to 34, the demographic groups most similar to Haitians are Immigrants from Lebanon (6.0%, a difference of 0.090%), Cypriot (6.0%, a difference of 0.090%), Immigrants from Japan (6.0%, a difference of 0.21%), Immigrants from Turkey (6.1%, a difference of 0.29%), and Immigrants from Greece (6.0%, a difference of 0.48%).
| Demographics | Rating | Rank | Disability Age 18 to 34 |
| Immigrants | North Macedonia | 99.5 /100 | #67 | Exceptional 6.0% |
| Immigrants | Poland | 99.5 /100 | #68 | Exceptional 6.0% |
| Immigrants | West Indies | 99.4 /100 | #69 | Exceptional 6.0% |
| Immigrants | Greece | 99.4 /100 | #70 | Exceptional 6.0% |
| Immigrants | Japan | 99.3 /100 | #71 | Exceptional 6.0% |
| Immigrants | Lebanon | 99.2 /100 | #72 | Exceptional 6.0% |
| Cypriots | 99.2 /100 | #73 | Exceptional 6.0% |
| Haitians | 99.2 /100 | #74 | Exceptional 6.0% |
| Immigrants | Turkey | 99.1 /100 | #75 | Exceptional 6.1% |
| Immigrants | Western Asia | 98.9 /100 | #76 | Exceptional 6.1% |
| Immigrants | Russia | 98.9 /100 | #77 | Exceptional 6.1% |
| Assyrians/Chaldeans/Syriacs | 98.9 /100 | #78 | Exceptional 6.1% |
| Afghans | 98.7 /100 | #79 | Exceptional 6.1% |
| Immigrants | Chile | 98.5 /100 | #80 | Exceptional 6.1% |
| Immigrants | Australia | 98.5 /100 | #81 | Exceptional 6.1% |
Demographics Similar to Immigrants from Sierra Leone by Disability Age 18 to 34
In terms of disability age 18 to 34, the demographic groups most similar to Immigrants from Sierra Leone are Immigrants from Panama (6.5%, a difference of 0.030%), Zimbabwean (6.5%, a difference of 0.030%), Dominican (6.5%, a difference of 0.14%), Immigrants from Central America (6.5%, a difference of 0.17%), and Inupiat (6.5%, a difference of 0.17%).
| Demographics | Rating | Rank | Disability Age 18 to 34 |
| Immigrants | Dominican Republic | 82.7 /100 | #150 | Excellent 6.4% |
| Tongans | 81.9 /100 | #151 | Excellent 6.4% |
| Bulgarians | 78.3 /100 | #152 | Good 6.5% |
| Immigrants | Eritrea | 77.4 /100 | #153 | Good 6.5% |
| Immigrants | Central America | 76.8 /100 | #154 | Good 6.5% |
| Inupiat | 76.7 /100 | #155 | Good 6.5% |
| Immigrants | Panama | 75.3 /100 | #156 | Good 6.5% |
| Immigrants | Sierra Leone | 75.0 /100 | #157 | Good 6.5% |
| Zimbabweans | 74.7 /100 | #158 | Good 6.5% |
| Dominicans | 73.6 /100 | #159 | Good 6.5% |
| Immigrants | Southern Europe | 72.5 /100 | #160 | Good 6.5% |
| Arabs | 72.3 /100 | #161 | Good 6.5% |
| South Africans | 71.7 /100 | #162 | Good 6.5% |
| Immigrants | Denmark | 71.7 /100 | #163 | Good 6.5% |
| Immigrants | Nigeria | 70.4 /100 | #164 | Good 6.5% |