Spanish American Indian vs Immigrants from Netherlands Births to Unmarried Women
COMPARE
Spanish American Indian
Immigrants from Netherlands
Births to Unmarried Women
Births to Unmarried Women Comparison
Spanish American Indians
Immigrants from Netherlands
37.4%
BIRTHS TO UNMARRIED WOMEN
0.0/ 100
METRIC RATING
283rd/ 347
METRIC RANK
29.9%
BIRTHS TO UNMARRIED WOMEN
91.1/ 100
METRIC RATING
117th/ 347
METRIC RANK
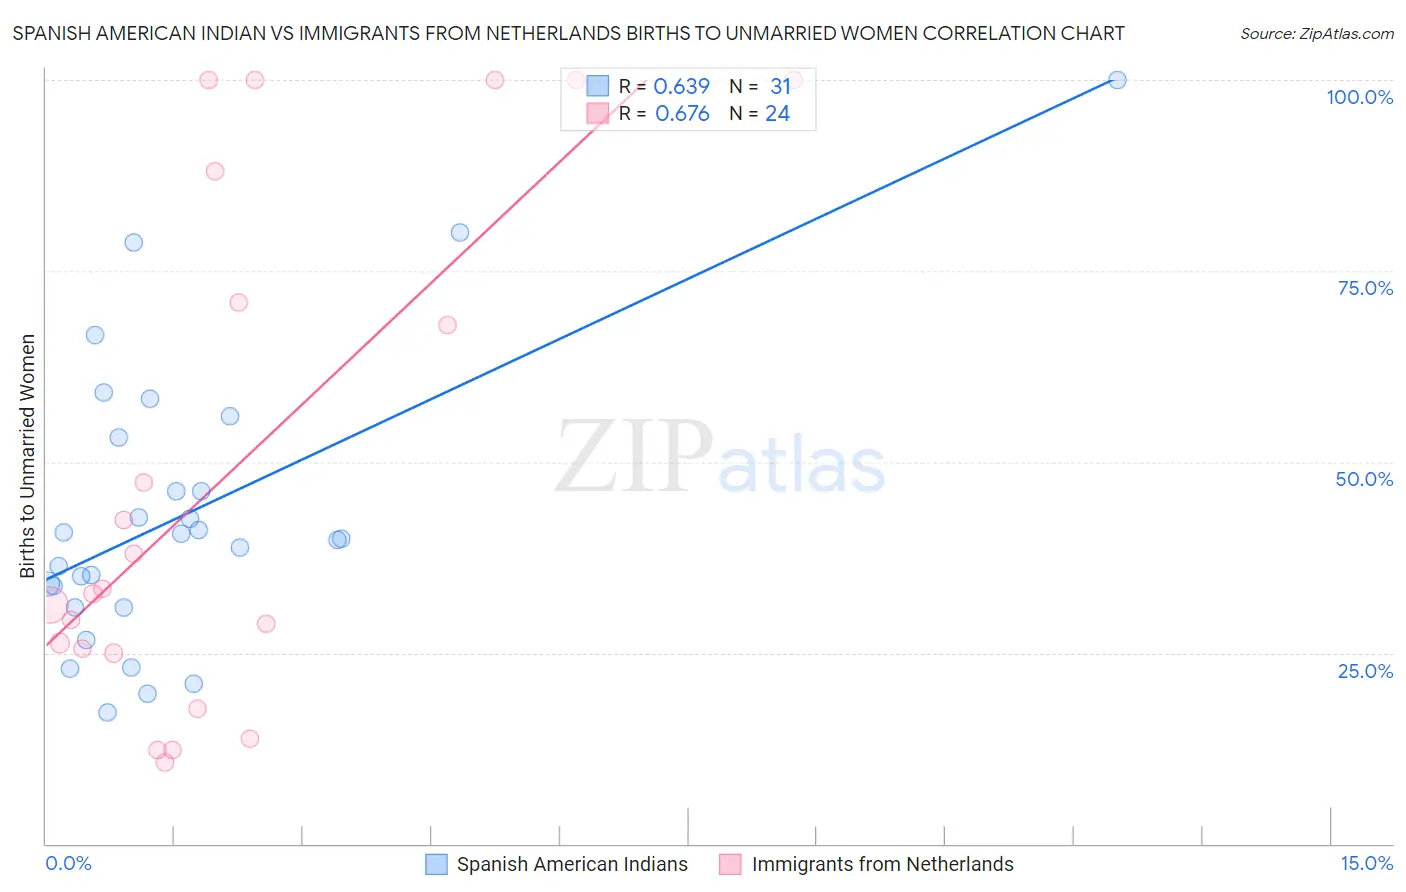
Spanish American Indian vs Immigrants from Netherlands Births to Unmarried Women Correlation Chart
The statistical analysis conducted on geographies consisting of 72,423,979 people shows a significant positive correlation between the proportion of Spanish American Indians and percentage of births to unmarried women in the United States with a correlation coefficient (R) of 0.639 and weighted average of 37.4%. Similarly, the statistical analysis conducted on geographies consisting of 223,807,985 people shows a significant positive correlation between the proportion of Immigrants from Netherlands and percentage of births to unmarried women in the United States with a correlation coefficient (R) of 0.676 and weighted average of 29.9%, a difference of 25.0%.
Births to Unmarried Women Correlation Summary
| Measurement | Spanish American Indian | Immigrants from Netherlands |
| Minimum | 17.2% | 10.7% |
| Maximum | 100.0% | 100.0% |
| Range | 82.8% | 89.3% |
| Mean | 43.1% | 48.1% |
| Median | 40.0% | 33.1% |
| Interquartile 25% (IQ1) | 31.0% | 25.2% |
| Interquartile 75% (IQ3) | 53.2% | 79.5% |
| Interquartile Range (IQR) | 22.2% | 54.3% |
| Standard Deviation (Sample) | 18.9% | 33.1% |
| Standard Deviation (Population) | 18.6% | 32.4% |
Similar Demographics by Births to Unmarried Women
Demographics Similar to Spanish American Indians by Births to Unmarried Women
In terms of births to unmarried women, the demographic groups most similar to Spanish American Indians are Immigrants from Central America (37.4%, a difference of 0.060%), Liberian (37.4%, a difference of 0.080%), Immigrants from Mexico (37.5%, a difference of 0.16%), Immigrants from Guatemala (37.5%, a difference of 0.18%), and Immigrants from Belize (37.3%, a difference of 0.25%).
| Demographics | Rating | Rank | Births to Unmarried Women |
| Belizeans | 0.1 /100 | #276 | Tragic 37.0% |
| Guatemalans | 0.1 /100 | #277 | Tragic 37.1% |
| Immigrants | Latin America | 0.1 /100 | #278 | Tragic 37.1% |
| West Indians | 0.1 /100 | #279 | Tragic 37.3% |
| Immigrants | St. Vincent and the Grenadines | 0.1 /100 | #280 | Tragic 37.3% |
| Immigrants | Belize | 0.1 /100 | #281 | Tragic 37.3% |
| Liberians | 0.0 /100 | #282 | Tragic 37.4% |
| Spanish American Indians | 0.0 /100 | #283 | Tragic 37.4% |
| Immigrants | Central America | 0.0 /100 | #284 | Tragic 37.4% |
| Immigrants | Mexico | 0.0 /100 | #285 | Tragic 37.5% |
| Immigrants | Guatemala | 0.0 /100 | #286 | Tragic 37.5% |
| Creek | 0.0 /100 | #287 | Tragic 37.6% |
| Immigrants | Liberia | 0.0 /100 | #288 | Tragic 37.6% |
| Alaskan Athabascans | 0.0 /100 | #289 | Tragic 37.7% |
| Hispanics or Latinos | 0.0 /100 | #290 | Tragic 37.8% |
Demographics Similar to Immigrants from Netherlands by Births to Unmarried Women
In terms of births to unmarried women, the demographic groups most similar to Immigrants from Netherlands are Immigrants from Norway (29.9%, a difference of 0.020%), Argentinean (30.0%, a difference of 0.16%), Immigrants from Italy (29.9%, a difference of 0.21%), Ethiopian (29.8%, a difference of 0.29%), and Immigrants from Croatia (29.8%, a difference of 0.50%).
| Demographics | Rating | Rank | Births to Unmarried Women |
| Immigrants | Ethiopia | 93.4 /100 | #110 | Exceptional 29.7% |
| Immigrants | Hungary | 93.0 /100 | #111 | Exceptional 29.7% |
| Basques | 93.0 /100 | #112 | Exceptional 29.7% |
| Scandinavians | 92.7 /100 | #113 | Exceptional 29.8% |
| Immigrants | Croatia | 92.6 /100 | #114 | Exceptional 29.8% |
| Ethiopians | 91.9 /100 | #115 | Exceptional 29.8% |
| Immigrants | Italy | 91.7 /100 | #116 | Exceptional 29.9% |
| Immigrants | Netherlands | 91.1 /100 | #117 | Exceptional 29.9% |
| Immigrants | Norway | 91.0 /100 | #118 | Exceptional 29.9% |
| Argentineans | 90.5 /100 | #119 | Exceptional 30.0% |
| Ugandans | 89.2 /100 | #120 | Excellent 30.1% |
| Koreans | 88.9 /100 | #121 | Excellent 30.1% |
| Immigrants | Argentina | 88.7 /100 | #122 | Excellent 30.1% |
| Syrians | 88.2 /100 | #123 | Excellent 30.2% |
| Croatians | 88.0 /100 | #124 | Excellent 30.2% |