Spanish American Indian vs French Canadian Female Disability
COMPARE
Spanish American Indian
French Canadian
Female Disability
Female Disability Comparison
Spanish American Indians
French Canadians
12.6%
FEMALE DISABILITY
2.1/ 100
METRIC RATING
246th/ 347
METRIC RANK
13.6%
FEMALE DISABILITY
0.0/ 100
METRIC RATING
306th/ 347
METRIC RANK
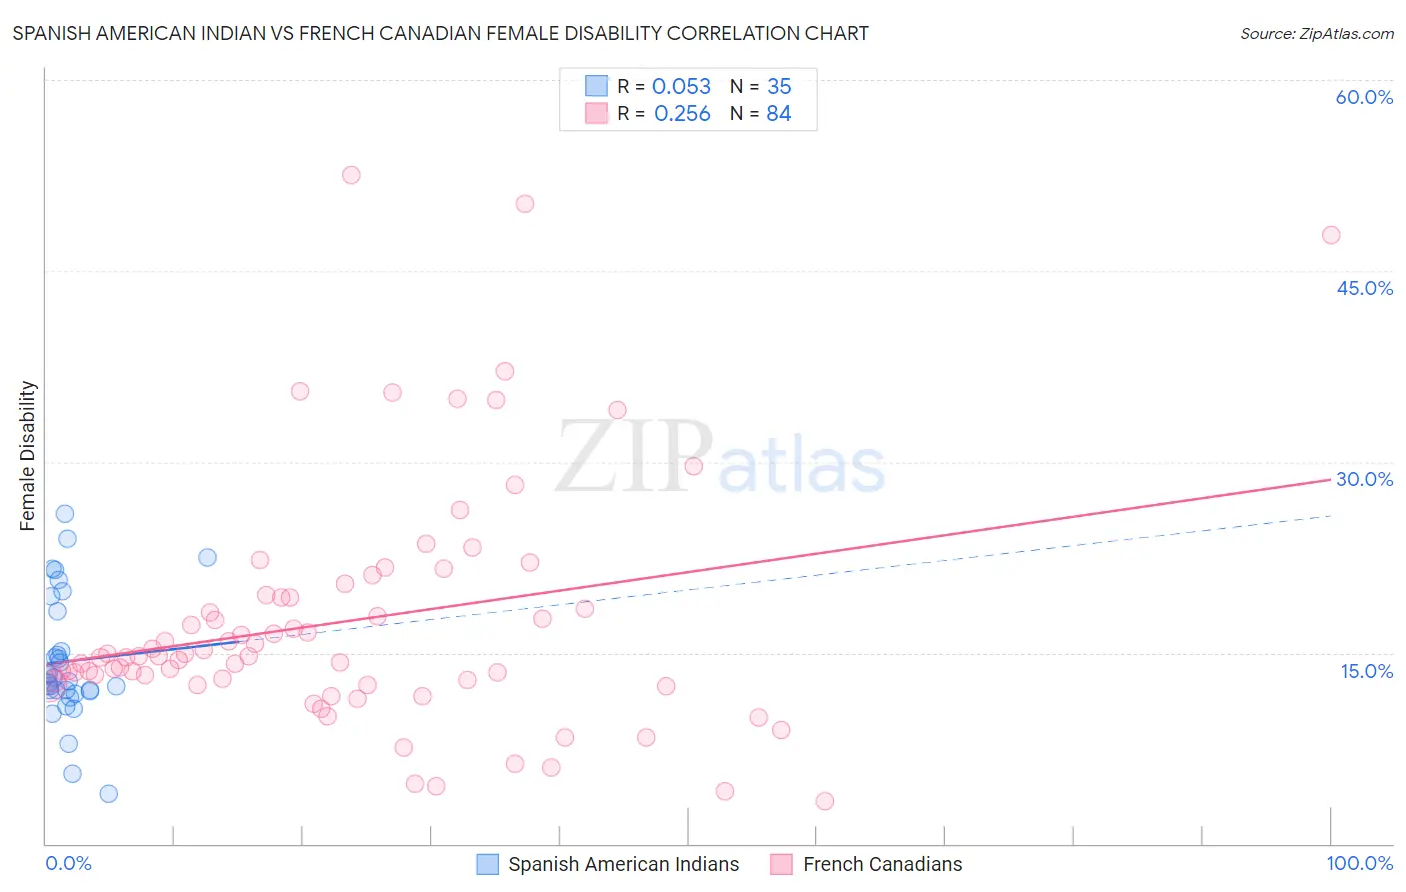
Spanish American Indian vs French Canadian Female Disability Correlation Chart
The statistical analysis conducted on geographies consisting of 73,149,277 people shows a slight positive correlation between the proportion of Spanish American Indians and percentage of females with a disability in the United States with a correlation coefficient (R) of 0.053 and weighted average of 12.6%. Similarly, the statistical analysis conducted on geographies consisting of 502,526,551 people shows a weak positive correlation between the proportion of French Canadians and percentage of females with a disability in the United States with a correlation coefficient (R) of 0.256 and weighted average of 13.6%, a difference of 7.5%.
Female Disability Correlation Summary
| Measurement | Spanish American Indian | French Canadian |
| Minimum | 3.9% | 3.4% |
| Maximum | 25.9% | 52.5% |
| Range | 22.0% | 49.1% |
| Mean | 14.3% | 17.5% |
| Median | 12.7% | 14.7% |
| Interquartile 25% (IQ1) | 12.0% | 12.7% |
| Interquartile 75% (IQ3) | 18.2% | 19.5% |
| Interquartile Range (IQR) | 6.2% | 6.8% |
| Standard Deviation (Sample) | 5.0% | 9.7% |
| Standard Deviation (Population) | 4.9% | 9.6% |
Similar Demographics by Female Disability
Demographics Similar to Spanish American Indians by Female Disability
In terms of female disability, the demographic groups most similar to Spanish American Indians are Menominee (12.6%, a difference of 0.010%), Immigrants from Jamaica (12.6%, a difference of 0.020%), Carpatho Rusyn (12.6%, a difference of 0.050%), Alsatian (12.6%, a difference of 0.15%), and Immigrants from Senegal (12.6%, a difference of 0.16%).
| Demographics | Rating | Rank | Female Disability |
| Barbadians | 3.6 /100 | #239 | Tragic 12.6% |
| German Russians | 3.2 /100 | #240 | Tragic 12.6% |
| Japanese | 2.7 /100 | #241 | Tragic 12.6% |
| Canadians | 2.6 /100 | #242 | Tragic 12.6% |
| Immigrants | Senegal | 2.5 /100 | #243 | Tragic 12.6% |
| Alsatians | 2.5 /100 | #244 | Tragic 12.6% |
| Immigrants | Jamaica | 2.2 /100 | #245 | Tragic 12.6% |
| Spanish American Indians | 2.1 /100 | #246 | Tragic 12.6% |
| Menominee | 2.1 /100 | #247 | Tragic 12.6% |
| Carpatho Rusyns | 2.0 /100 | #248 | Tragic 12.6% |
| Immigrants | Congo | 1.8 /100 | #249 | Tragic 12.7% |
| Slovenes | 1.7 /100 | #250 | Tragic 12.7% |
| Crow | 1.6 /100 | #251 | Tragic 12.7% |
| Immigrants | Caribbean | 1.4 /100 | #252 | Tragic 12.7% |
| Jamaicans | 1.4 /100 | #253 | Tragic 12.7% |
Demographics Similar to French Canadians by Female Disability
In terms of female disability, the demographic groups most similar to French Canadians are Central American Indian (13.6%, a difference of 0.29%), Dominican (13.5%, a difference of 0.63%), Cree (13.7%, a difference of 0.75%), French American Indian (13.7%, a difference of 0.81%), and Apache (13.7%, a difference of 0.93%).
| Demographics | Rating | Rank | Female Disability |
| Immigrants | Dominican Republic | 0.0 /100 | #299 | Tragic 13.4% |
| Pennsylvania Germans | 0.0 /100 | #300 | Tragic 13.4% |
| Africans | 0.0 /100 | #301 | Tragic 13.4% |
| Scotch-Irish | 0.0 /100 | #302 | Tragic 13.4% |
| Immigrants | Portugal | 0.0 /100 | #303 | Tragic 13.5% |
| Immigrants | Micronesia | 0.0 /100 | #304 | Tragic 13.5% |
| Dominicans | 0.0 /100 | #305 | Tragic 13.5% |
| French Canadians | 0.0 /100 | #306 | Tragic 13.6% |
| Central American Indians | 0.0 /100 | #307 | Tragic 13.6% |
| Cree | 0.0 /100 | #308 | Tragic 13.7% |
| French American Indians | 0.0 /100 | #309 | Tragic 13.7% |
| Apache | 0.0 /100 | #310 | Tragic 13.7% |
| Hopi | 0.0 /100 | #311 | Tragic 13.7% |
| Delaware | 0.0 /100 | #312 | Tragic 13.8% |
| Blackfeet | 0.0 /100 | #313 | Tragic 13.8% |