Spanish American Indian vs Indian (Asian) Female Disability
COMPARE
Spanish American Indian
Indian (Asian)
Female Disability
Female Disability Comparison
Spanish American Indians
Indians (Asian)
12.6%
FEMALE DISABILITY
2.1/ 100
METRIC RATING
246th/ 347
METRIC RANK
10.8%
FEMALE DISABILITY
100.0/ 100
METRIC RATING
17th/ 347
METRIC RANK
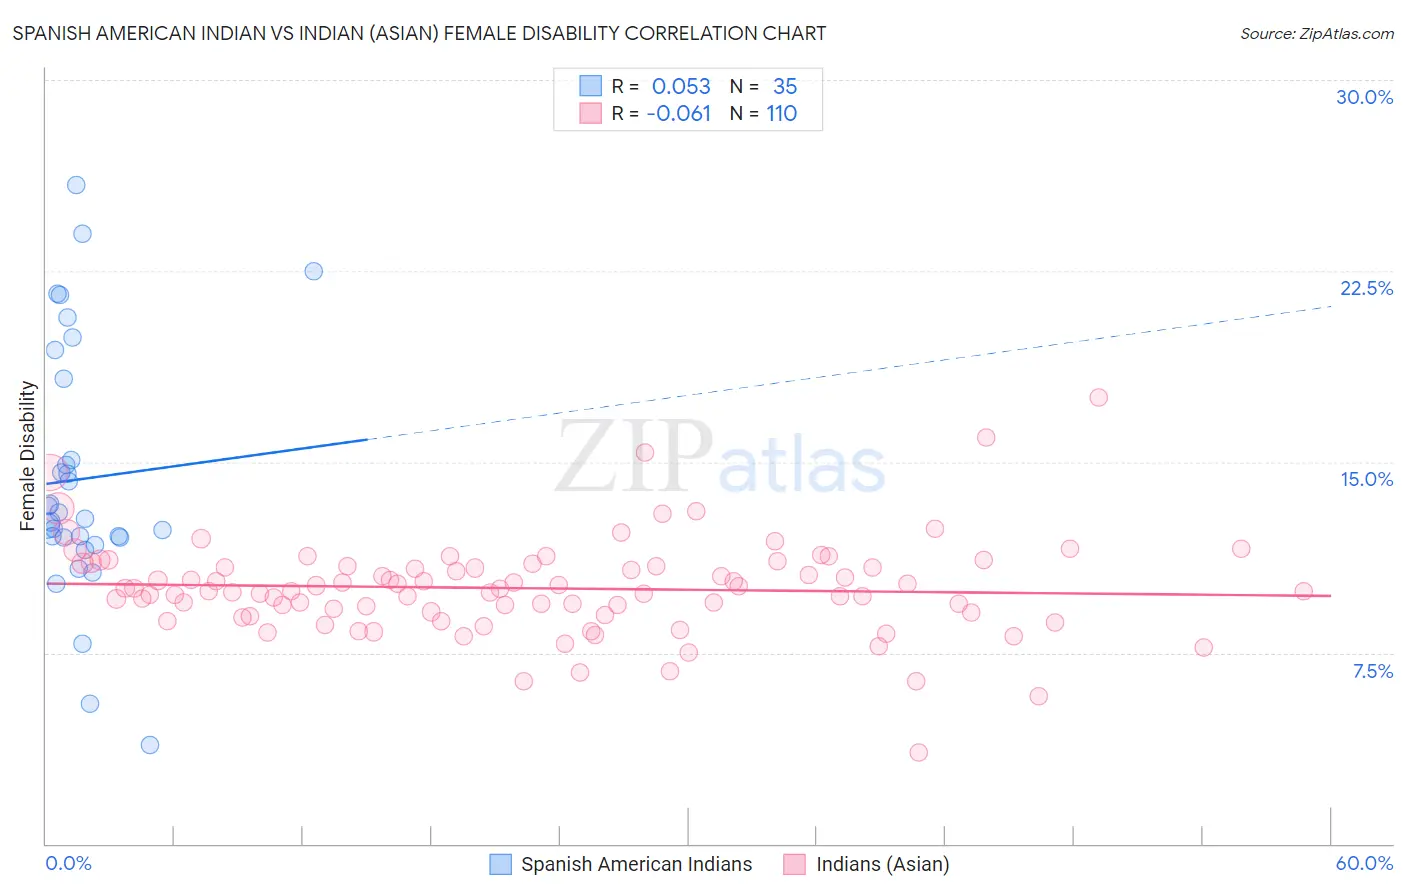
Spanish American Indian vs Indian (Asian) Female Disability Correlation Chart
The statistical analysis conducted on geographies consisting of 73,149,277 people shows a slight positive correlation between the proportion of Spanish American Indians and percentage of females with a disability in the United States with a correlation coefficient (R) of 0.053 and weighted average of 12.6%. Similarly, the statistical analysis conducted on geographies consisting of 495,223,198 people shows a slight negative correlation between the proportion of Indians (Asian) and percentage of females with a disability in the United States with a correlation coefficient (R) of -0.061 and weighted average of 10.8%, a difference of 17.1%.
Female Disability Correlation Summary
| Measurement | Spanish American Indian | Indian (Asian) |
| Minimum | 3.9% | 3.6% |
| Maximum | 25.9% | 17.5% |
| Range | 22.0% | 13.9% |
| Mean | 14.3% | 10.0% |
| Median | 12.7% | 10.0% |
| Interquartile 25% (IQ1) | 12.0% | 9.1% |
| Interquartile 75% (IQ3) | 18.2% | 10.9% |
| Interquartile Range (IQR) | 6.2% | 1.8% |
| Standard Deviation (Sample) | 5.0% | 1.9% |
| Standard Deviation (Population) | 4.9% | 1.9% |
Similar Demographics by Female Disability
Demographics Similar to Spanish American Indians by Female Disability
In terms of female disability, the demographic groups most similar to Spanish American Indians are Menominee (12.6%, a difference of 0.010%), Immigrants from Jamaica (12.6%, a difference of 0.020%), Carpatho Rusyn (12.6%, a difference of 0.050%), Alsatian (12.6%, a difference of 0.15%), and Immigrants from Senegal (12.6%, a difference of 0.16%).
| Demographics | Rating | Rank | Female Disability |
| Barbadians | 3.6 /100 | #239 | Tragic 12.6% |
| German Russians | 3.2 /100 | #240 | Tragic 12.6% |
| Japanese | 2.7 /100 | #241 | Tragic 12.6% |
| Canadians | 2.6 /100 | #242 | Tragic 12.6% |
| Immigrants | Senegal | 2.5 /100 | #243 | Tragic 12.6% |
| Alsatians | 2.5 /100 | #244 | Tragic 12.6% |
| Immigrants | Jamaica | 2.2 /100 | #245 | Tragic 12.6% |
| Spanish American Indians | 2.1 /100 | #246 | Tragic 12.6% |
| Menominee | 2.1 /100 | #247 | Tragic 12.6% |
| Carpatho Rusyns | 2.0 /100 | #248 | Tragic 12.6% |
| Immigrants | Congo | 1.8 /100 | #249 | Tragic 12.7% |
| Slovenes | 1.7 /100 | #250 | Tragic 12.7% |
| Crow | 1.6 /100 | #251 | Tragic 12.7% |
| Immigrants | Caribbean | 1.4 /100 | #252 | Tragic 12.7% |
| Jamaicans | 1.4 /100 | #253 | Tragic 12.7% |
Demographics Similar to Indians (Asian) by Female Disability
In terms of female disability, the demographic groups most similar to Indians (Asian) are Okinawan (10.8%, a difference of 0.32%), Immigrants from Iran (10.8%, a difference of 0.38%), Burmese (10.7%, a difference of 0.39%), Immigrants from Venezuela (10.9%, a difference of 0.60%), and Immigrants from Pakistan (10.9%, a difference of 0.77%).
| Demographics | Rating | Rank | Female Disability |
| Immigrants | Hong Kong | 100.0 /100 | #10 | Exceptional 10.6% |
| Immigrants | Korea | 100.0 /100 | #11 | Exceptional 10.6% |
| Immigrants | Israel | 100.0 /100 | #12 | Exceptional 10.7% |
| Immigrants | Eastern Asia | 100.0 /100 | #13 | Exceptional 10.7% |
| Immigrants | China | 100.0 /100 | #14 | Exceptional 10.7% |
| Burmese | 100.0 /100 | #15 | Exceptional 10.7% |
| Okinawans | 100.0 /100 | #16 | Exceptional 10.8% |
| Indians (Asian) | 100.0 /100 | #17 | Exceptional 10.8% |
| Immigrants | Iran | 100.0 /100 | #18 | Exceptional 10.8% |
| Immigrants | Venezuela | 100.0 /100 | #19 | Exceptional 10.9% |
| Immigrants | Pakistan | 100.0 /100 | #20 | Exceptional 10.9% |
| Asians | 100.0 /100 | #21 | Exceptional 10.9% |
| Immigrants | Sri Lanka | 100.0 /100 | #22 | Exceptional 10.9% |
| Venezuelans | 100.0 /100 | #23 | Exceptional 11.0% |
| Immigrants | Argentina | 100.0 /100 | #24 | Exceptional 11.0% |