Israeli vs French Canadian Female Disability
COMPARE
Israeli
French Canadian
Female Disability
Female Disability Comparison
Israelis
French Canadians
11.2%
FEMALE DISABILITY
100.0/ 100
METRIC RATING
42nd/ 347
METRIC RANK
13.6%
FEMALE DISABILITY
0.0/ 100
METRIC RATING
306th/ 347
METRIC RANK
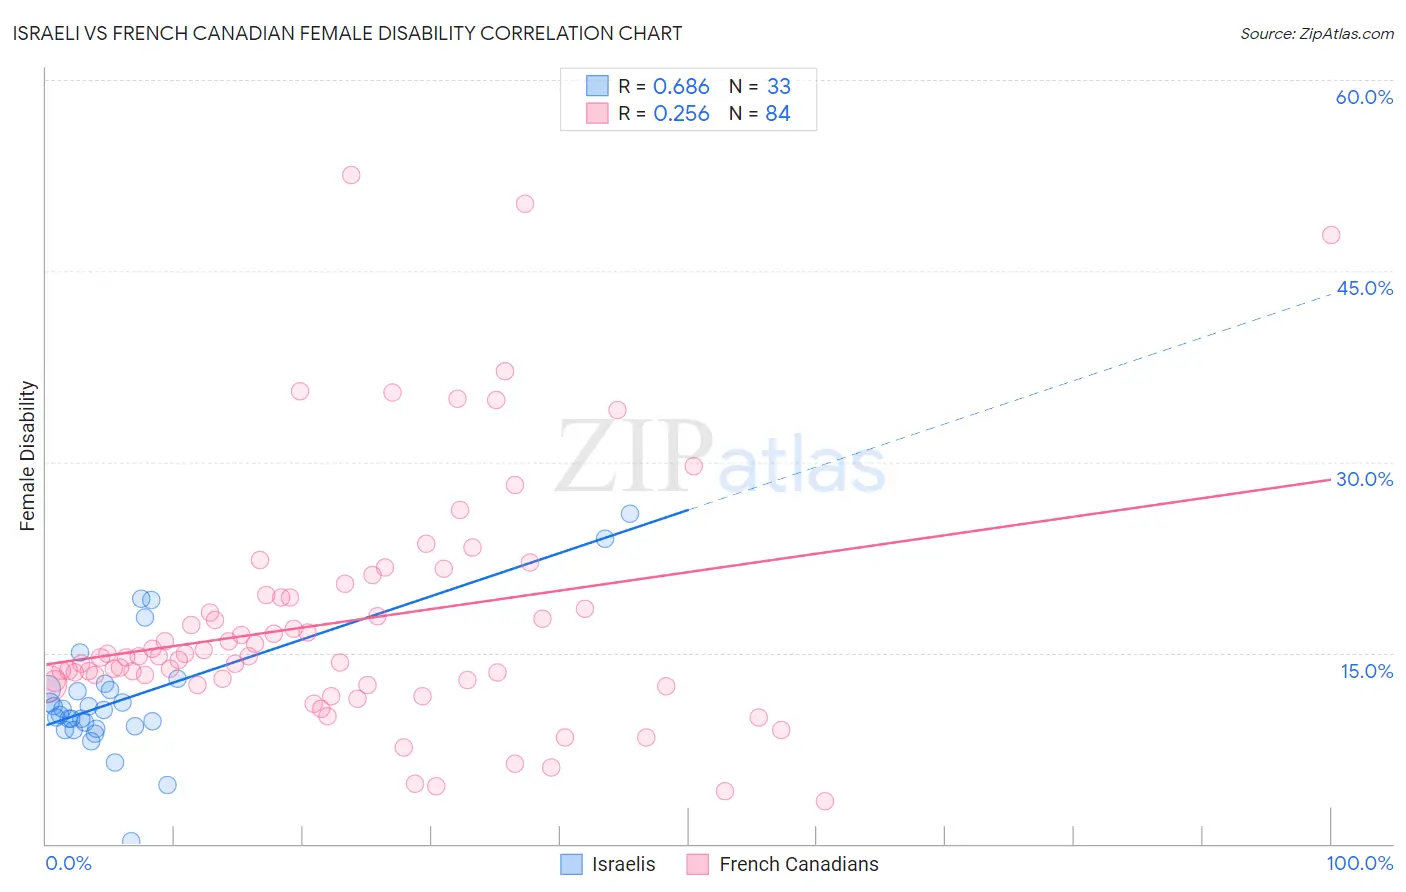
Israeli vs French Canadian Female Disability Correlation Chart
The statistical analysis conducted on geographies consisting of 211,173,315 people shows a significant positive correlation between the proportion of Israelis and percentage of females with a disability in the United States with a correlation coefficient (R) of 0.686 and weighted average of 11.2%. Similarly, the statistical analysis conducted on geographies consisting of 502,526,551 people shows a weak positive correlation between the proportion of French Canadians and percentage of females with a disability in the United States with a correlation coefficient (R) of 0.256 and weighted average of 13.6%, a difference of 20.9%.
Female Disability Correlation Summary
| Measurement | Israeli | French Canadian |
| Minimum | 0.17% | 3.4% |
| Maximum | 25.9% | 52.5% |
| Range | 25.8% | 49.1% |
| Mean | 11.5% | 17.5% |
| Median | 10.5% | 14.7% |
| Interquartile 25% (IQ1) | 9.1% | 12.7% |
| Interquartile 75% (IQ3) | 12.3% | 19.5% |
| Interquartile Range (IQR) | 3.2% | 6.8% |
| Standard Deviation (Sample) | 5.0% | 9.7% |
| Standard Deviation (Population) | 4.9% | 9.6% |
Similar Demographics by Female Disability
Demographics Similar to Israelis by Female Disability
In terms of female disability, the demographic groups most similar to Israelis are Afghan (11.2%, a difference of 0.030%), Paraguayan (11.2%, a difference of 0.10%), Mongolian (11.2%, a difference of 0.11%), Immigrants from Lithuania (11.2%, a difference of 0.15%), and Cambodian (11.3%, a difference of 0.22%).
| Demographics | Rating | Rank | Female Disability |
| Immigrants | Japan | 100.0 /100 | #35 | Exceptional 11.2% |
| Cypriots | 100.0 /100 | #36 | Exceptional 11.2% |
| Ethiopians | 100.0 /100 | #37 | Exceptional 11.2% |
| Immigrants | Ethiopia | 100.0 /100 | #38 | Exceptional 11.2% |
| Immigrants | Lithuania | 100.0 /100 | #39 | Exceptional 11.2% |
| Mongolians | 100.0 /100 | #40 | Exceptional 11.2% |
| Paraguayans | 100.0 /100 | #41 | Exceptional 11.2% |
| Israelis | 100.0 /100 | #42 | Exceptional 11.2% |
| Afghans | 100.0 /100 | #43 | Exceptional 11.2% |
| Cambodians | 100.0 /100 | #44 | Exceptional 11.3% |
| Immigrants | Sweden | 100.0 /100 | #45 | Exceptional 11.3% |
| Immigrants | Nepal | 100.0 /100 | #46 | Exceptional 11.3% |
| Jordanians | 100.0 /100 | #47 | Exceptional 11.3% |
| Zimbabweans | 100.0 /100 | #48 | Exceptional 11.3% |
| Tongans | 100.0 /100 | #49 | Exceptional 11.3% |
Demographics Similar to French Canadians by Female Disability
In terms of female disability, the demographic groups most similar to French Canadians are Central American Indian (13.6%, a difference of 0.29%), Dominican (13.5%, a difference of 0.63%), Cree (13.7%, a difference of 0.75%), French American Indian (13.7%, a difference of 0.81%), and Apache (13.7%, a difference of 0.93%).
| Demographics | Rating | Rank | Female Disability |
| Immigrants | Dominican Republic | 0.0 /100 | #299 | Tragic 13.4% |
| Pennsylvania Germans | 0.0 /100 | #300 | Tragic 13.4% |
| Africans | 0.0 /100 | #301 | Tragic 13.4% |
| Scotch-Irish | 0.0 /100 | #302 | Tragic 13.4% |
| Immigrants | Portugal | 0.0 /100 | #303 | Tragic 13.5% |
| Immigrants | Micronesia | 0.0 /100 | #304 | Tragic 13.5% |
| Dominicans | 0.0 /100 | #305 | Tragic 13.5% |
| French Canadians | 0.0 /100 | #306 | Tragic 13.6% |
| Central American Indians | 0.0 /100 | #307 | Tragic 13.6% |
| Cree | 0.0 /100 | #308 | Tragic 13.7% |
| French American Indians | 0.0 /100 | #309 | Tragic 13.7% |
| Apache | 0.0 /100 | #310 | Tragic 13.7% |
| Hopi | 0.0 /100 | #311 | Tragic 13.7% |
| Delaware | 0.0 /100 | #312 | Tragic 13.8% |
| Blackfeet | 0.0 /100 | #313 | Tragic 13.8% |