South American Indian vs Immigrants from Eastern Africa Disability Age 35 to 64
COMPARE
South American Indian
Immigrants from Eastern Africa
Disability Age 35 to 64
Disability Age 35 to 64 Comparison
South American Indians
Immigrants from Eastern Africa
10.9%
DISABILITY AGE 35 TO 64
83.5/ 100
METRIC RATING
146th/ 347
METRIC RANK
11.3%
DISABILITY AGE 35 TO 64
42.2/ 100
METRIC RATING
177th/ 347
METRIC RANK
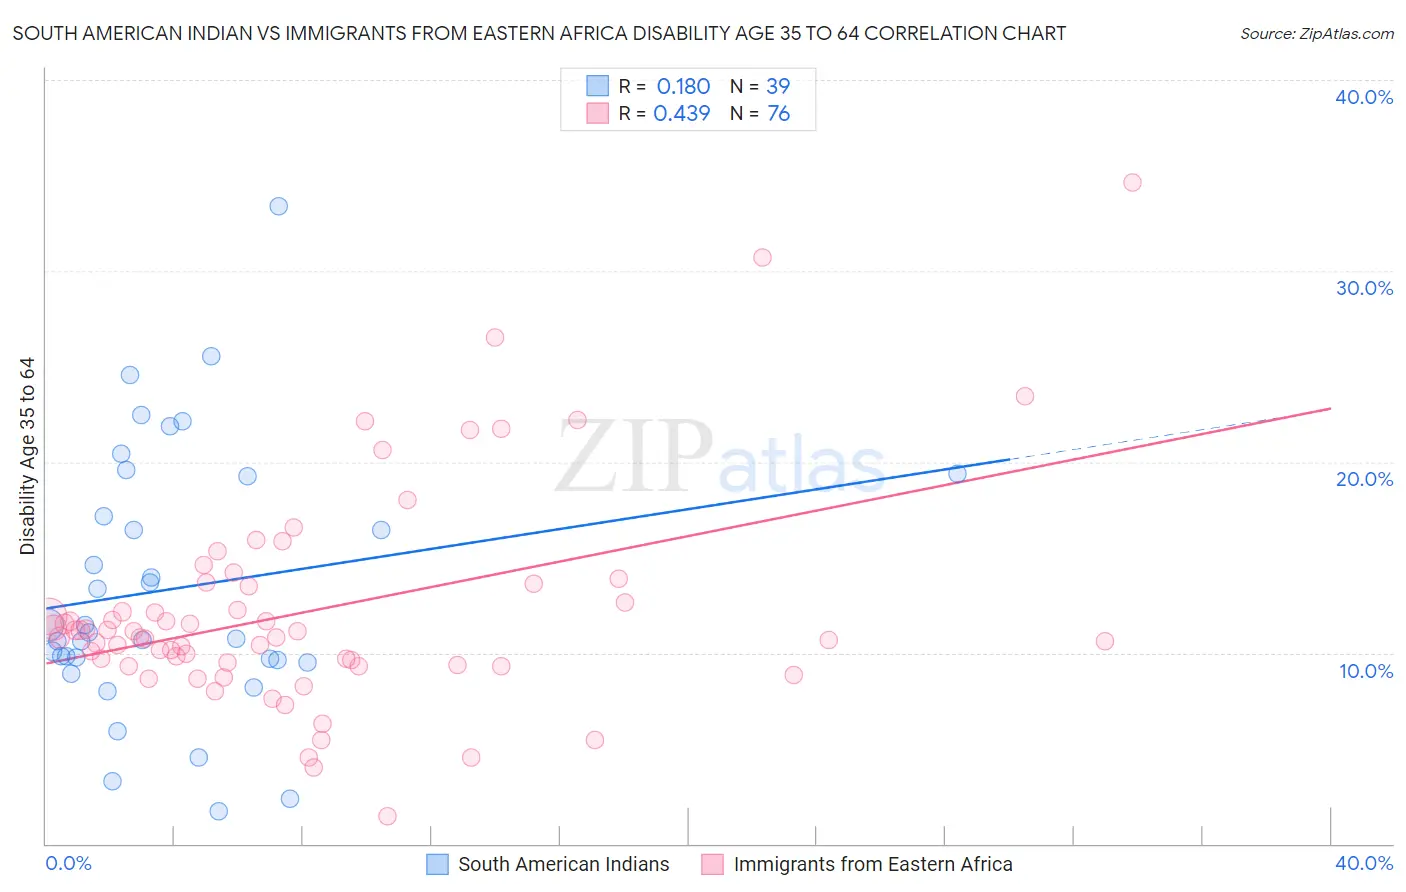
South American Indian vs Immigrants from Eastern Africa Disability Age 35 to 64 Correlation Chart
The statistical analysis conducted on geographies consisting of 164,539,388 people shows a poor positive correlation between the proportion of South American Indians and percentage of population with a disability between the ages 34 and 64 in the United States with a correlation coefficient (R) of 0.180 and weighted average of 10.9%. Similarly, the statistical analysis conducted on geographies consisting of 354,876,335 people shows a moderate positive correlation between the proportion of Immigrants from Eastern Africa and percentage of population with a disability between the ages 34 and 64 in the United States with a correlation coefficient (R) of 0.439 and weighted average of 11.3%, a difference of 4.0%.
Disability Age 35 to 64 Correlation Summary
| Measurement | South American Indian | Immigrants from Eastern Africa |
| Minimum | 1.7% | 1.4% |
| Maximum | 33.4% | 34.6% |
| Range | 31.7% | 33.2% |
| Mean | 13.4% | 12.2% |
| Median | 11.1% | 11.0% |
| Interquartile 25% (IQ1) | 9.6% | 9.4% |
| Interquartile 75% (IQ3) | 19.3% | 13.6% |
| Interquartile Range (IQR) | 9.6% | 4.1% |
| Standard Deviation (Sample) | 6.9% | 5.7% |
| Standard Deviation (Population) | 6.8% | 5.6% |
Similar Demographics by Disability Age 35 to 64
Demographics Similar to South American Indians by Disability Age 35 to 64
In terms of disability age 35 to 64, the demographic groups most similar to South American Indians are Immigrants from Eritrea (10.9%, a difference of 0.020%), Arab (10.9%, a difference of 0.12%), Immigrants from Bangladesh (10.9%, a difference of 0.34%), Immigrants from Cameroon (10.9%, a difference of 0.34%), and Syrian (11.0%, a difference of 0.51%).
| Demographics | Rating | Rank | Disability Age 35 to 64 |
| Costa Ricans | 91.4 /100 | #139 | Exceptional 10.7% |
| Immigrants | Scotland | 91.3 /100 | #140 | Exceptional 10.7% |
| Australians | 90.7 /100 | #141 | Exceptional 10.8% |
| Immigrants | Saudi Arabia | 90.6 /100 | #142 | Exceptional 10.8% |
| Sierra Leoneans | 89.7 /100 | #143 | Excellent 10.8% |
| Lithuanians | 88.7 /100 | #144 | Excellent 10.8% |
| Immigrants | Bangladesh | 85.6 /100 | #145 | Excellent 10.9% |
| South American Indians | 83.5 /100 | #146 | Excellent 10.9% |
| Immigrants | Eritrea | 83.4 /100 | #147 | Excellent 10.9% |
| Arabs | 82.7 /100 | #148 | Excellent 10.9% |
| Immigrants | Cameroon | 81.1 /100 | #149 | Excellent 10.9% |
| Syrians | 79.8 /100 | #150 | Good 11.0% |
| New Zealanders | 79.3 /100 | #151 | Good 11.0% |
| Ukrainians | 78.0 /100 | #152 | Good 11.0% |
| Immigrants | England | 77.4 /100 | #153 | Good 11.0% |
Demographics Similar to Immigrants from Eastern Africa by Disability Age 35 to 64
In terms of disability age 35 to 64, the demographic groups most similar to Immigrants from Eastern Africa are Polish (11.3%, a difference of 0.020%), Immigrants from Barbados (11.3%, a difference of 0.060%), Immigrants from Caribbean (11.3%, a difference of 0.060%), Ugandan (11.3%, a difference of 0.12%), and Trinidadian and Tobagonian (11.4%, a difference of 0.12%).
| Demographics | Rating | Rank | Disability Age 35 to 64 |
| Immigrants | Uganda | 58.0 /100 | #170 | Average 11.2% |
| Immigrants | Trinidad and Tobago | 55.9 /100 | #171 | Average 11.2% |
| Italians | 55.6 /100 | #172 | Average 11.2% |
| Lebanese | 51.8 /100 | #173 | Average 11.3% |
| Immigrants | Fiji | 50.0 /100 | #174 | Average 11.3% |
| Czechs | 47.9 /100 | #175 | Average 11.3% |
| Ugandans | 43.7 /100 | #176 | Average 11.3% |
| Immigrants | Eastern Africa | 42.2 /100 | #177 | Average 11.3% |
| Poles | 42.0 /100 | #178 | Average 11.3% |
| Immigrants | Barbados | 41.6 /100 | #179 | Average 11.3% |
| Immigrants | Caribbean | 41.5 /100 | #180 | Average 11.3% |
| Trinidadians and Tobagonians | 40.8 /100 | #181 | Average 11.4% |
| Icelanders | 39.7 /100 | #182 | Fair 11.4% |
| Immigrants | Oceania | 39.5 /100 | #183 | Fair 11.4% |
| Kenyans | 39.2 /100 | #184 | Fair 11.4% |