Slovene vs Immigrants from Western Asia Ambulatory Disability

COMPARE

Slovene
Race
Ancestry
AfghanAfricanAlaska NativeAlaskan AthabascanAlbanianAleutAlsatianAmericanApacheArabArapahoArgentineanArmenianAssyrian/Chaldean/SyriacAustralianAustrianBahamianBangladeshiBarbadianBasqueBelgianBelizeanBermudanBhutaneseBlackfeetBolivianBrazilianBritishBritish West IndianBulgarianBurmeseCajunCambodianCanadianCape VerdeanCarpatho RusynCelticCentral AmericanCentral American IndianCherokeeCheyenneChickasawChileanChineseChippewaChoctawColombianColvilleComancheCosta RicanCreeCreekCroatianCrowCubanCypriotCzechCzechoslovakianDanishDelawareDominicanDutchDutch West IndianEastern EuropeanEcuadorianEgyptianEnglishEstonianEthiopianEuropeanFijianFilipinoFinnishFrenchFrench American IndianFrench CanadianGermanGerman RussianGhanaianGreekGuamanian/ChamorroGuatemalanGuyaneseHaitianHmongHonduranHopiHoumaHungarianIcelanderIndian (Asian)IndonesianInupiatIranianIraqiIrishIroquoisIsraeliItalianJamaicanJapaneseJordanianKenyanKiowaKoreanLaotianLatvianLebaneseLiberianLithuanianLumbeeLuxembourgerMacedonianMalaysianMalteseMarshalleseMenomineeMexicanMexican American IndianMongolianMoroccanNative HawaiianNavajoNepaleseNew ZealanderNicaraguanNigerianNorthern EuropeanNorwegianOkinawanOsageOttawaPaiutePakistaniPalestinianPanamanianParaguayanPennsylvania GermanPeruvianPimaPolishPortuguesePotawatomiPuebloPuerto RicanPuget Sound SalishRomanianRussianSalvadoranSamoanScandinavianScotch-IrishScottishSeminoleSenegaleseSerbianShoshoneSierra LeoneanSiouxSlavicSlovakSloveneSomaliSouth AfricanSouth AmericanSouth American IndianSoviet UnionSpaniardSpanishSpanish AmericanSpanish American IndianSri LankanSubsaharan AfricanSudaneseSwedishSwissSyrianTaiwaneseThaiTlingit-HaidaTohono O'OdhamTonganTrinidadian and TobagonianTsimshianTurkishU.S. Virgin IslanderUgandanUkrainianUruguayanUteVenezuelanVietnameseWelshWest IndianYakamaYaquiYugoslavianYumanYup'ikZimbabwean
Immigration
NonimmigrantsImmigrantsAfghanistanAfricaAlbaniaArgentinaArmeniaAsiaAustraliaAustriaBahamasBangladeshBarbadosBelarusBelgiumBelizeBoliviaBosnia and HerzegovinaBrazilBulgariaBurma/MyanmarCabo VerdeCambodiaCameroonCanadaCaribbeanCentral AmericaChileChinaColombiaCongoCosta RicaCroatiaCubaCzechoslovakiaDenmarkDominicaDominican RepublicEastern AfricaEastern AsiaEastern EuropeEcuadorEgyptEl SalvadorEnglandEritreaEthiopiaEuropeFijiFranceGermanyGhanaGreeceGrenadaGuatemalaGuyanaHaitiHondurasHong KongHungaryIndiaIndonesiaIranIraqIrelandIsraelItalyJamaicaJapanJordanKazakhstanKenyaKoreaKuwaitLaosLatin AmericaLatviaLebanonLiberiaLithuaniaMalaysiaMexicoMicronesiaMiddle AfricaMoldovaMoroccoNepalNetherlandsNicaraguaNigeriaNorth AmericaNorth MacedoniaNorthern AfricaNorthern EuropeNorwayOceaniaPakistanPanamaPeruPhilippinesPolandPortugalRomaniaRussiaSaudi ArabiaScotlandSenegalSerbiaSierra LeoneSingaporeSomaliaSouth AfricaSouth AmericaSouth Central AsiaSouth Eastern AsiaSouthern EuropeSpainSri LankaSt. Vincent and the GrenadinesSudanSwedenSwitzerlandSyriaTaiwanThailandTrinidad and TobagoTurkeyUgandaUkraineUruguayUzbekistanVenezuelaVietnamWest IndiesWestern AfricaWestern EuropeYemenZaireZimbabweAzores
Immigrants from Western Asia
Race
Ancestry
AfghanAfricanAlaska NativeAlaskan AthabascanAlbanianAleutAlsatianAmericanApacheArabArapahoArgentineanArmenianAssyrian/Chaldean/SyriacAustralianAustrianBahamianBangladeshiBarbadianBasqueBelgianBelizeanBermudanBhutaneseBlackfeetBolivianBrazilianBritishBritish West IndianBulgarianBurmeseCajunCambodianCanadianCape VerdeanCarpatho RusynCelticCentral AmericanCentral American IndianCherokeeCheyenneChickasawChileanChineseChippewaChoctawColombianColvilleComancheCosta RicanCreeCreekCroatianCrowCubanCypriotCzechCzechoslovakianDanishDelawareDominicanDutchDutch West IndianEastern EuropeanEcuadorianEgyptianEnglishEstonianEthiopianEuropeanFijianFilipinoFinnishFrenchFrench American IndianFrench CanadianGermanGerman RussianGhanaianGreekGuamanian/ChamorroGuatemalanGuyaneseHaitianHmongHonduranHopiHoumaHungarianIcelanderIndian (Asian)IndonesianInupiatIranianIraqiIrishIroquoisIsraeliItalianJamaicanJapaneseJordanianKenyanKiowaKoreanLaotianLatvianLebaneseLiberianLithuanianLumbeeLuxembourgerMacedonianMalaysianMalteseMarshalleseMenomineeMexicanMexican American IndianMongolianMoroccanNative HawaiianNavajoNepaleseNew ZealanderNicaraguanNigerianNorthern EuropeanNorwegianOkinawanOsageOttawaPaiutePakistaniPalestinianPanamanianParaguayanPennsylvania GermanPeruvianPimaPolishPortuguesePotawatomiPuebloPuerto RicanPuget Sound SalishRomanianRussianSalvadoranSamoanScandinavianScotch-IrishScottishSeminoleSenegaleseSerbianShoshoneSierra LeoneanSiouxSlavicSlovakSomaliSouth AfricanSouth AmericanSouth American IndianSoviet UnionSpaniardSpanishSpanish AmericanSpanish American IndianSri LankanSubsaharan AfricanSudaneseSwedishSwissSyrianTaiwaneseThaiTlingit-HaidaTohono O'OdhamTonganTrinidadian and TobagonianTsimshianTurkishU.S. Virgin IslanderUgandanUkrainianUruguayanUteVenezuelanVietnameseWelshWest IndianYakamaYaquiYugoslavianYumanYup'ikZimbabwean
Immigration
NonimmigrantsImmigrantsAfghanistanAfricaAlbaniaArgentinaArmeniaAsiaAustraliaAustriaBahamasBangladeshBarbadosBelarusBelgiumBelizeBoliviaBosnia and HerzegovinaBrazilBulgariaBurma/MyanmarCabo VerdeCambodiaCameroonCanadaCaribbeanCentral AmericaChileChinaColombiaCongoCosta RicaCroatiaCubaCzechoslovakiaDenmarkDominicaDominican RepublicEastern AfricaEastern AsiaEastern EuropeEcuadorEgyptEl SalvadorEnglandEritreaEthiopiaEuropeFijiFranceGermanyGhanaGreeceGrenadaGuatemalaGuyanaHaitiHondurasHong KongHungaryIndiaIndonesiaIranIraqIrelandIsraelItalyJamaicaJapanJordanKazakhstanKenyaKoreaKuwaitLaosLatin AmericaLatviaLebanonLiberiaLithuaniaMalaysiaMexicoMicronesiaMiddle AfricaMoldovaMoroccoNepalNetherlandsNicaraguaNigeriaNorth AmericaNorth MacedoniaNorthern AfricaNorthern EuropeNorwayOceaniaPakistanPanamaPeruPhilippinesPolandPortugalRomaniaRussiaSaudi ArabiaScotlandSenegalSerbiaSierra LeoneSingaporeSomaliaSouth AfricaSouth AmericaSouth Central AsiaSouth Eastern AsiaSouthern EuropeSpainSri LankaSt. Vincent and the GrenadinesSudanSwedenSwitzerlandSyriaTaiwanThailandTrinidad and TobagoTurkeyUgandaUkraineUruguayUzbekistanVenezuelaVietnamWest IndiesWestern AfricaWestern AsiaWestern EuropeYemenZaireZimbabweAzores
Ambulatory Disability
Income
Poverty
Unemployment
Labor Participation
Family Structure
Vehicle Availability
Education Level
Disability

Ambulatory Disability Comparison

Slovenes

Immigrants from Western Asia

Poor
Exceptional
6.2%
AMBULATORY DISABILITY
18.0/ 100
METRIC RATING
205th/ 347
METRIC RANK
5.9%
AMBULATORY DISABILITY
90.7/ 100
METRIC RATING
128th/ 347
METRIC RANK

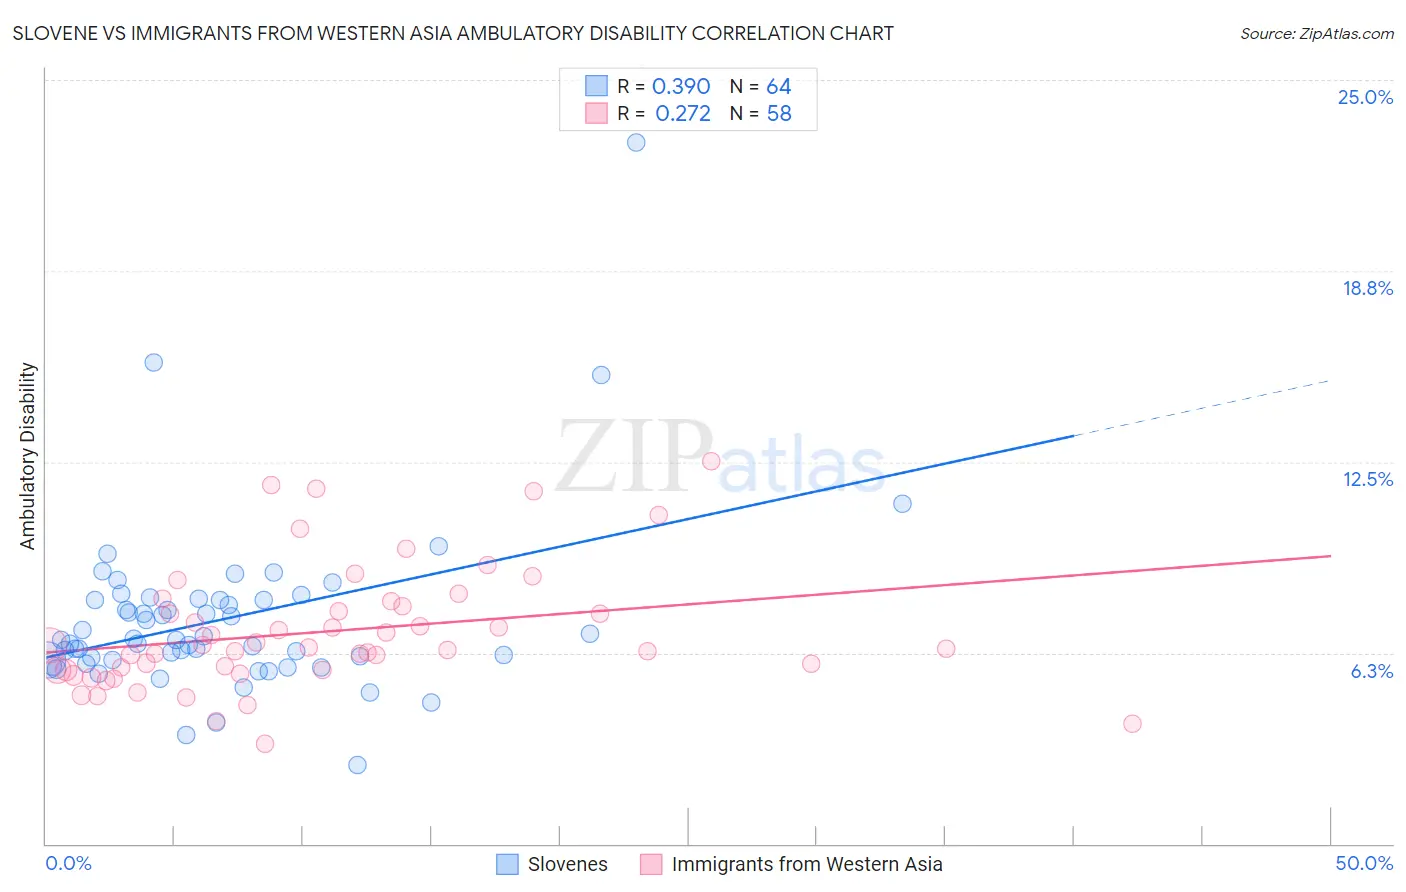
Slovene vs Immigrants from Western Asia Ambulatory Disability Correlation Chart

The statistical analysis conducted on geographies consisting of 261,334,117 people shows a mild positive correlation between the proportion of Slovenes and percentage of population with ambulatory disability in the United States with a correlation coefficient (R) of 0.390 and weighted average of 6.2%. Similarly, the statistical analysis conducted on geographies consisting of 404,333,266 people shows a weak positive correlation between the proportion of Immigrants from Western Asia and percentage of population with ambulatory disability in the United States with a correlation coefficient (R) of 0.272 and weighted average of 5.9%, a difference of 5.2%.
Slovene vs Immigrants from Western Asia Ambulatory Disability

Ambulatory Disability Correlation Summary

MeasurementSloveneImmigrants from Western Asia
Minimum2.6%3.3%
Maximum23.0%12.5%
Range20.4%9.3%
Mean7.3%6.9%
Median6.7%6.4%
Interquartile 25% (IQ1)6.0%5.7%
Interquartile 75% (IQ3)8.0%7.8%
Interquartile Range (IQR)2.0%2.1%
Standard Deviation (Sample)2.9%2.0%
Standard Deviation (Population)2.9%2.0%

Similar Demographics by Ambulatory Disability

Demographics Similar to Slovenes by Ambulatory Disability

In terms of ambulatory disability, the demographic groups most similar to Slovenes are Immigrants from Congo (6.2%, a difference of 0.020%), Immigrants from Ukraine (6.2%, a difference of 0.030%), Finnish (6.2%, a difference of 0.070%), Albanian (6.2%, a difference of 0.15%), and Immigrants from Central America (6.2%, a difference of 0.17%).
DemographicsRating | RankAmbulatory Disability
Immigrants | Bangladesh
24.6
/100
|
#198
Fair
6.2%
Italians
22.6
/100
|
#199
Fair
6.2%
Immigrants | Cambodia
21.5
/100
|
#200
Fair
6.2%
Immigrants | Central America
20.1
/100
|
#201
Fair
6.2%
Albanians
19.7
/100
|
#202
Poor
6.2%
Immigrants | Ukraine
18.4
/100
|
#203
Poor
6.2%
Immigrants | Congo
18.2
/100
|
#204
Poor
6.2%
Slovenes
18.0
/100
|
#205
Poor
6.2%
Finns
17.2
/100
|
#206
Poor
6.2%
Alsatians
15.1
/100
|
#207
Poor
6.3%
Bangladeshis
14.2
/100
|
#208
Poor
6.3%
Immigrants | Iraq
14.0
/100
|
#209
Poor
6.3%
Immigrants | Laos
13.2
/100
|
#210
Poor
6.3%
Samoans
12.1
/100
|
#211
Poor
6.3%
Mexican American Indians
12.0
/100
|
#212
Poor
6.3%

Demographics Similar to Immigrants from Western Asia by Ambulatory Disability

In terms of ambulatory disability, the demographic groups most similar to Immigrants from Western Asia are Immigrants from Norway (5.9%, a difference of 0.030%), Immigrants from Nigeria (5.9%, a difference of 0.040%), Arab (5.9%, a difference of 0.13%), Immigrants from Kazakhstan (5.9%, a difference of 0.14%), and Korean (5.9%, a difference of 0.15%).
DemographicsRating | RankAmbulatory Disability
Costa Ricans
92.6
/100
|
#121
Exceptional
5.9%
Icelanders
92.6
/100
|
#122
Exceptional
5.9%
Immigrants | Russia
92.4
/100
|
#123
Exceptional
5.9%
Immigrants | Middle Africa
92.2
/100
|
#124
Exceptional
5.9%
Koreans
91.6
/100
|
#125
Exceptional
5.9%
Arabs
91.5
/100
|
#126
Exceptional
5.9%
Immigrants | Nigeria
90.9
/100
|
#127
Exceptional
5.9%
Immigrants | Western Asia
90.7
/100
|
#128
Exceptional
5.9%
Immigrants | Norway
90.5
/100
|
#129
Exceptional
5.9%
Immigrants | Kazakhstan
89.7
/100
|
#130
Excellent
5.9%
Immigrants | Costa Rica
89.5
/100
|
#131
Excellent
5.9%
Immigrants | Europe
87.8
/100
|
#132
Excellent
6.0%
Immigrants | Immigrants
86.9
/100
|
#133
Excellent
6.0%
Ute
86.6
/100
|
#134
Excellent
6.0%
Immigrants | Italy
85.0
/100
|
#135
Excellent
6.0%