Paraguayan vs Cambodian Ambulatory Disability
COMPARE
Paraguayan
Cambodian
Ambulatory Disability
Ambulatory Disability Comparison
Paraguayans
Cambodians
5.5%
AMBULATORY DISABILITY
99.9/ 100
METRIC RATING
43rd/ 347
METRIC RANK
5.4%
AMBULATORY DISABILITY
100.0/ 100
METRIC RATING
28th/ 347
METRIC RANK
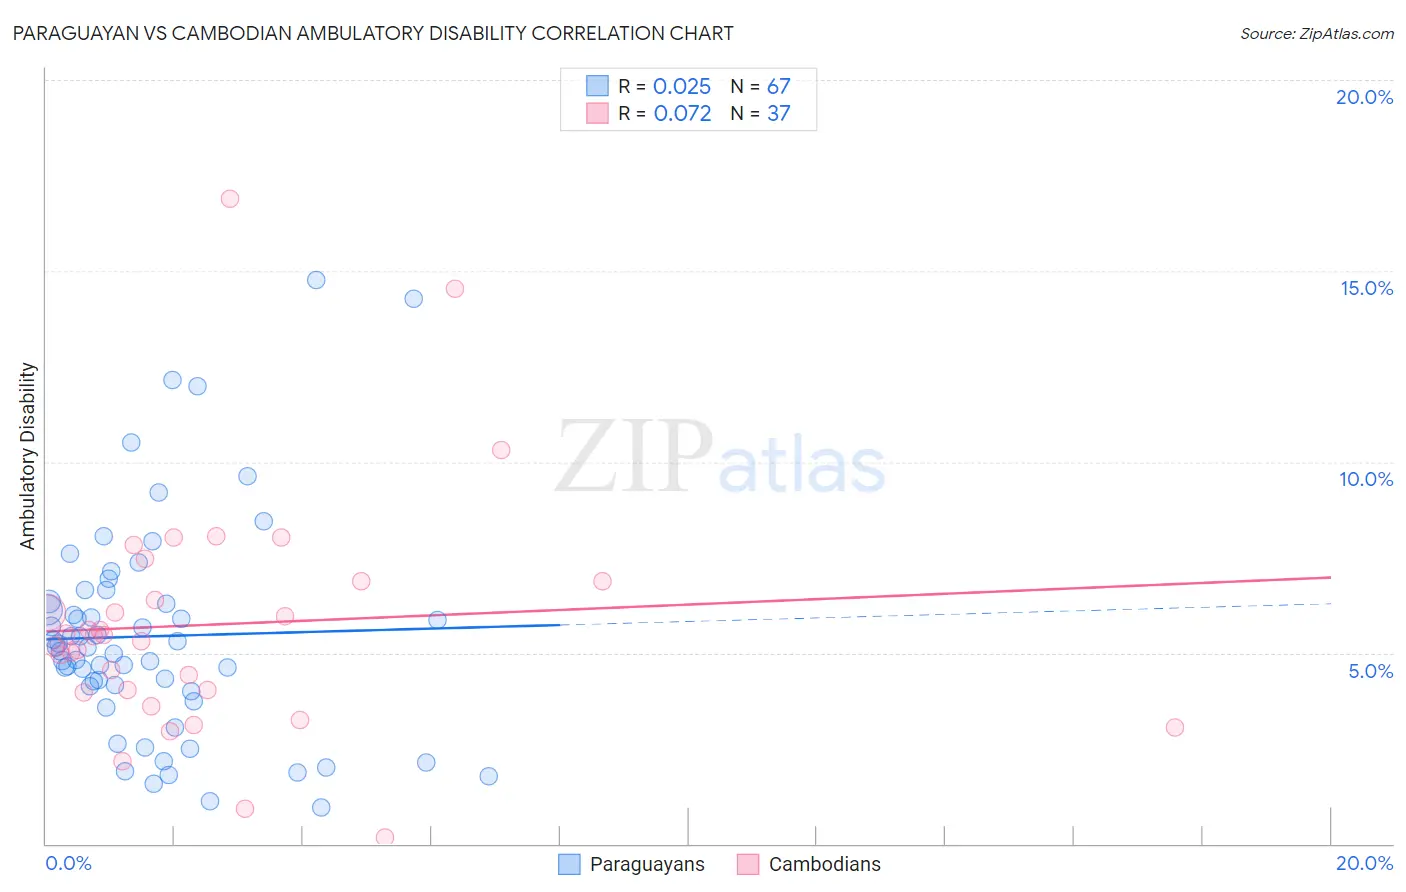
Paraguayan vs Cambodian Ambulatory Disability Correlation Chart
The statistical analysis conducted on geographies consisting of 95,109,897 people shows no correlation between the proportion of Paraguayans and percentage of population with ambulatory disability in the United States with a correlation coefficient (R) of 0.025 and weighted average of 5.5%. Similarly, the statistical analysis conducted on geographies consisting of 102,504,705 people shows a slight positive correlation between the proportion of Cambodians and percentage of population with ambulatory disability in the United States with a correlation coefficient (R) of 0.072 and weighted average of 5.4%, a difference of 2.5%.
Ambulatory Disability Correlation Summary
| Measurement | Paraguayan | Cambodian |
| Minimum | 0.94% | 0.17% |
| Maximum | 14.7% | 16.9% |
| Range | 13.8% | 16.7% |
| Mean | 5.4% | 5.7% |
| Median | 5.2% | 5.4% |
| Interquartile 25% (IQ1) | 4.0% | 4.0% |
| Interquartile 75% (IQ3) | 6.3% | 6.9% |
| Interquartile Range (IQR) | 2.4% | 2.9% |
| Standard Deviation (Sample) | 2.9% | 3.2% |
| Standard Deviation (Population) | 2.8% | 3.1% |
Demographics Similar to Paraguayans and Cambodians by Ambulatory Disability
In terms of ambulatory disability, the demographic groups most similar to Paraguayans are Immigrants from Indonesia (5.5%, a difference of 0.12%), Immigrants from Sweden (5.6%, a difference of 0.28%), Argentinean (5.5%, a difference of 0.54%), Mongolian (5.5%, a difference of 0.61%), and Venezuelan (5.5%, a difference of 0.70%). Similarly, the demographic groups most similar to Cambodians are Asian (5.4%, a difference of 0.060%), Immigrants from Iran (5.4%, a difference of 0.10%), Immigrants from Nepal (5.4%, a difference of 0.22%), Zimbabwean (5.4%, a difference of 0.25%), and Immigrants from Turkey (5.4%, a difference of 0.71%).
| Demographics | Rating | Rank | Ambulatory Disability |
| Zimbabweans | 100.0 /100 | #25 | Exceptional 5.4% |
| Immigrants | Nepal | 100.0 /100 | #26 | Exceptional 5.4% |
| Asians | 100.0 /100 | #27 | Exceptional 5.4% |
| Cambodians | 100.0 /100 | #28 | Exceptional 5.4% |
| Immigrants | Iran | 100.0 /100 | #29 | Exceptional 5.4% |
| Immigrants | Turkey | 100.0 /100 | #30 | Exceptional 5.4% |
| Immigrants | Venezuela | 100.0 /100 | #31 | Exceptional 5.4% |
| Immigrants | Australia | 100.0 /100 | #32 | Exceptional 5.5% |
| Immigrants | Pakistan | 100.0 /100 | #33 | Exceptional 5.5% |
| Immigrants | Asia | 100.0 /100 | #34 | Exceptional 5.5% |
| Afghans | 100.0 /100 | #35 | Exceptional 5.5% |
| Immigrants | Malaysia | 100.0 /100 | #36 | Exceptional 5.5% |
| Turks | 100.0 /100 | #37 | Exceptional 5.5% |
| Cypriots | 100.0 /100 | #38 | Exceptional 5.5% |
| Immigrants | Eritrea | 100.0 /100 | #39 | Exceptional 5.5% |
| Venezuelans | 99.9 /100 | #40 | Exceptional 5.5% |
| Mongolians | 99.9 /100 | #41 | Exceptional 5.5% |
| Argentineans | 99.9 /100 | #42 | Exceptional 5.5% |
| Paraguayans | 99.9 /100 | #43 | Exceptional 5.5% |
| Immigrants | Indonesia | 99.9 /100 | #44 | Exceptional 5.5% |
| Immigrants | Sweden | 99.9 /100 | #45 | Exceptional 5.6% |