Iroquois vs Cambodian Ambulatory Disability
COMPARE
Iroquois
Cambodian
Ambulatory Disability
Ambulatory Disability Comparison
Iroquois
Cambodians
7.1%
AMBULATORY DISABILITY
0.0/ 100
METRIC RATING
306th/ 347
METRIC RANK
5.4%
AMBULATORY DISABILITY
100.0/ 100
METRIC RATING
28th/ 347
METRIC RANK
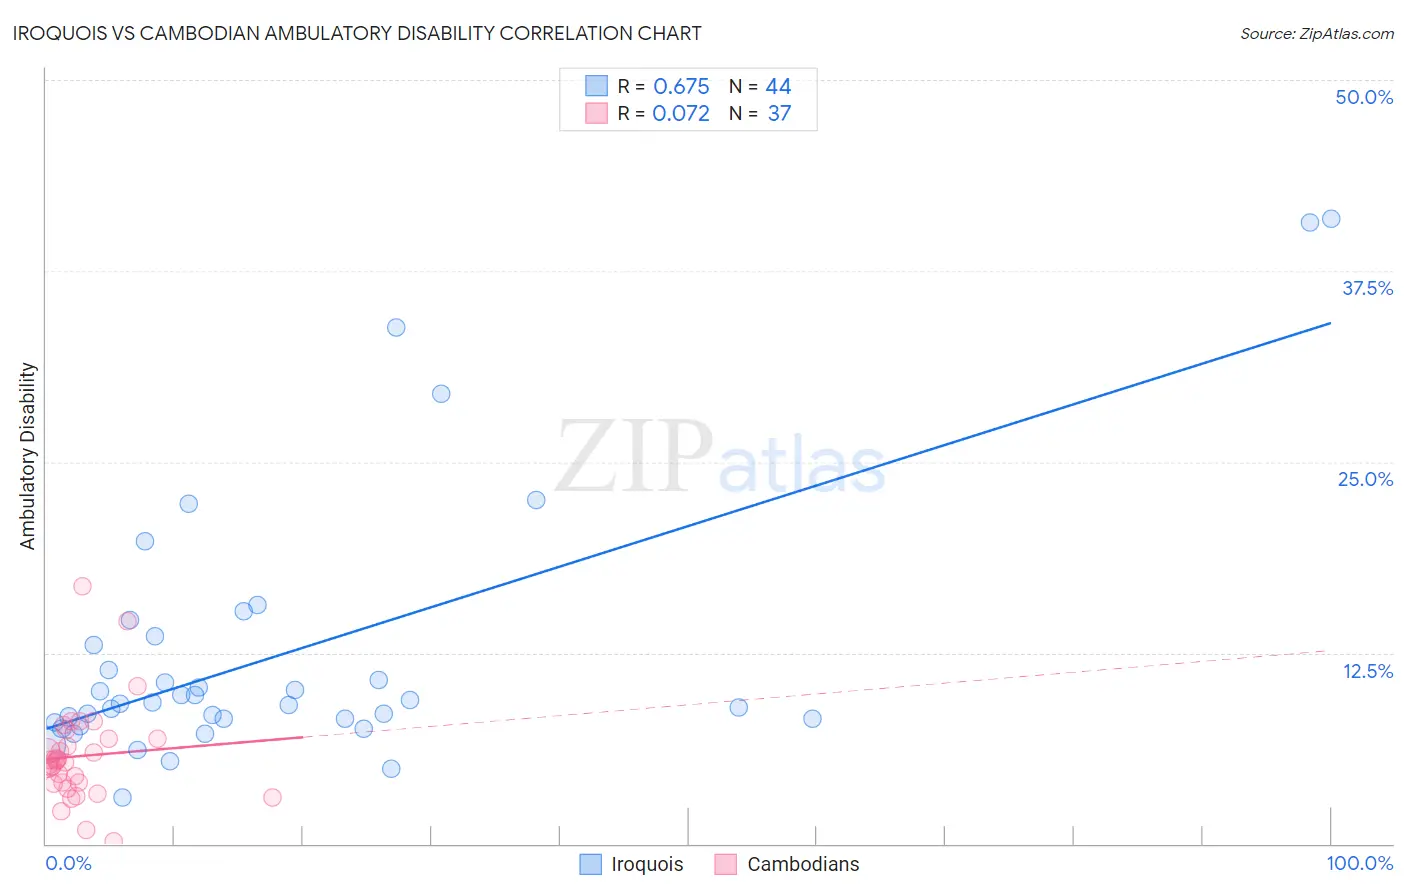
Iroquois vs Cambodian Ambulatory Disability Correlation Chart
The statistical analysis conducted on geographies consisting of 207,272,935 people shows a significant positive correlation between the proportion of Iroquois and percentage of population with ambulatory disability in the United States with a correlation coefficient (R) of 0.675 and weighted average of 7.1%. Similarly, the statistical analysis conducted on geographies consisting of 102,504,705 people shows a slight positive correlation between the proportion of Cambodians and percentage of population with ambulatory disability in the United States with a correlation coefficient (R) of 0.072 and weighted average of 5.4%, a difference of 30.4%.
Ambulatory Disability Correlation Summary
| Measurement | Iroquois | Cambodian |
| Minimum | 3.0% | 0.17% |
| Maximum | 40.9% | 16.9% |
| Range | 37.9% | 16.7% |
| Mean | 12.5% | 5.7% |
| Median | 9.2% | 5.4% |
| Interquartile 25% (IQ1) | 8.0% | 4.0% |
| Interquartile 75% (IQ3) | 13.3% | 6.9% |
| Interquartile Range (IQR) | 5.2% | 2.9% |
| Standard Deviation (Sample) | 8.7% | 3.2% |
| Standard Deviation (Population) | 8.6% | 3.1% |
Similar Demographics by Ambulatory Disability
Demographics Similar to Iroquois by Ambulatory Disability
In terms of ambulatory disability, the demographic groups most similar to Iroquois are Spanish American (7.1%, a difference of 0.26%), Chippewa (7.1%, a difference of 0.27%), Immigrants from the Azores (7.1%, a difference of 0.44%), Immigrants from Micronesia (7.0%, a difference of 0.53%), and Arapaho (7.1%, a difference of 0.72%).
| Demographics | Rating | Rank | Ambulatory Disability |
| Puget Sound Salish | 0.0 /100 | #299 | Tragic 6.9% |
| Marshallese | 0.0 /100 | #300 | Tragic 6.9% |
| British West Indians | 0.0 /100 | #301 | Tragic 7.0% |
| Immigrants | Armenia | 0.0 /100 | #302 | Tragic 7.0% |
| Africans | 0.0 /100 | #303 | Tragic 7.0% |
| Immigrants | Cabo Verde | 0.0 /100 | #304 | Tragic 7.0% |
| Immigrants | Micronesia | 0.0 /100 | #305 | Tragic 7.0% |
| Iroquois | 0.0 /100 | #306 | Tragic 7.1% |
| Spanish Americans | 0.0 /100 | #307 | Tragic 7.1% |
| Chippewa | 0.0 /100 | #308 | Tragic 7.1% |
| Immigrants | Azores | 0.0 /100 | #309 | Tragic 7.1% |
| Arapaho | 0.0 /100 | #310 | Tragic 7.1% |
| Cree | 0.0 /100 | #311 | Tragic 7.1% |
| Delaware | 0.0 /100 | #312 | Tragic 7.1% |
| Immigrants | Yemen | 0.0 /100 | #313 | Tragic 7.1% |
Demographics Similar to Cambodians by Ambulatory Disability
In terms of ambulatory disability, the demographic groups most similar to Cambodians are Asian (5.4%, a difference of 0.060%), Immigrants from Iran (5.4%, a difference of 0.10%), Immigrants from Nepal (5.4%, a difference of 0.22%), Zimbabwean (5.4%, a difference of 0.25%), and Immigrants from Saudi Arabia (5.4%, a difference of 0.33%).
| Demographics | Rating | Rank | Ambulatory Disability |
| Immigrants | Kuwait | 100.0 /100 | #21 | Exceptional 5.4% |
| Immigrants | Israel | 100.0 /100 | #22 | Exceptional 5.4% |
| Tongans | 100.0 /100 | #23 | Exceptional 5.4% |
| Immigrants | Saudi Arabia | 100.0 /100 | #24 | Exceptional 5.4% |
| Zimbabweans | 100.0 /100 | #25 | Exceptional 5.4% |
| Immigrants | Nepal | 100.0 /100 | #26 | Exceptional 5.4% |
| Asians | 100.0 /100 | #27 | Exceptional 5.4% |
| Cambodians | 100.0 /100 | #28 | Exceptional 5.4% |
| Immigrants | Iran | 100.0 /100 | #29 | Exceptional 5.4% |
| Immigrants | Turkey | 100.0 /100 | #30 | Exceptional 5.4% |
| Immigrants | Venezuela | 100.0 /100 | #31 | Exceptional 5.4% |
| Immigrants | Australia | 100.0 /100 | #32 | Exceptional 5.5% |
| Immigrants | Pakistan | 100.0 /100 | #33 | Exceptional 5.5% |
| Immigrants | Asia | 100.0 /100 | #34 | Exceptional 5.5% |
| Afghans | 100.0 /100 | #35 | Exceptional 5.5% |