American vs Immigrants from Western Africa Cognitive Disability
COMPARE
American
Immigrants from Western Africa
Cognitive Disability
Cognitive Disability Comparison
Americans
Immigrants from Western Africa
17.2%
COGNITIVE DISABILITY
72.2/ 100
METRIC RATING
161st/ 347
METRIC RANK
18.4%
COGNITIVE DISABILITY
0.0/ 100
METRIC RATING
308th/ 347
METRIC RANK
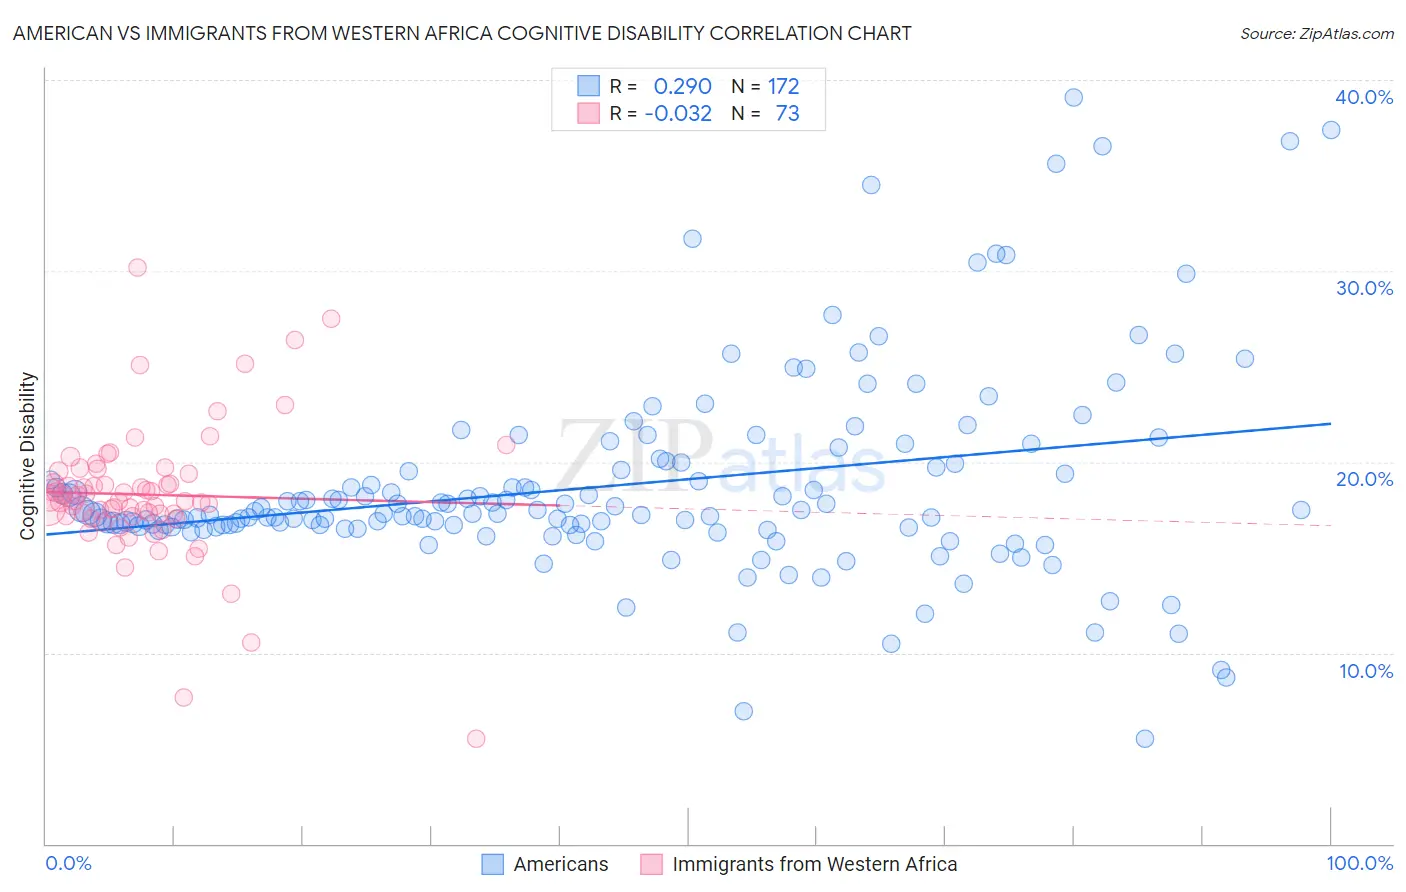
American vs Immigrants from Western Africa Cognitive Disability Correlation Chart
The statistical analysis conducted on geographies consisting of 581,739,029 people shows a weak positive correlation between the proportion of Americans and percentage of population with cognitive disability in the United States with a correlation coefficient (R) of 0.290 and weighted average of 17.2%. Similarly, the statistical analysis conducted on geographies consisting of 357,804,343 people shows no correlation between the proportion of Immigrants from Western Africa and percentage of population with cognitive disability in the United States with a correlation coefficient (R) of -0.032 and weighted average of 18.4%, a difference of 7.0%.
Cognitive Disability Correlation Summary
| Measurement | American | Immigrants from Western Africa |
| Minimum | 5.5% | 5.5% |
| Maximum | 39.1% | 30.2% |
| Range | 33.6% | 24.6% |
| Mean | 18.8% | 18.3% |
| Median | 17.3% | 17.9% |
| Interquartile 25% (IQ1) | 16.6% | 17.2% |
| Interquartile 75% (IQ3) | 19.8% | 19.5% |
| Interquartile Range (IQR) | 3.2% | 2.3% |
| Standard Deviation (Sample) | 5.3% | 3.6% |
| Standard Deviation (Population) | 5.3% | 3.6% |
Similar Demographics by Cognitive Disability
Demographics Similar to Americans by Cognitive Disability
In terms of cognitive disability, the demographic groups most similar to Americans are Australian (17.2%, a difference of 0.010%), Yugoslavian (17.2%, a difference of 0.020%), Immigrants from Switzerland (17.2%, a difference of 0.020%), Immigrants from Latvia (17.2%, a difference of 0.040%), and Celtic (17.1%, a difference of 0.070%).
| Demographics | Rating | Rank | Cognitive Disability |
| Immigrants | Malaysia | 79.3 /100 | #154 | Good 17.1% |
| Brazilians | 78.9 /100 | #155 | Good 17.1% |
| Sri Lankans | 78.9 /100 | #156 | Good 17.1% |
| Immigrants | Australia | 76.0 /100 | #157 | Good 17.1% |
| Celtics | 74.1 /100 | #158 | Good 17.1% |
| Immigrants | Latvia | 73.2 /100 | #159 | Good 17.2% |
| Australians | 72.4 /100 | #160 | Good 17.2% |
| Americans | 72.2 /100 | #161 | Good 17.2% |
| Yugoslavians | 71.6 /100 | #162 | Good 17.2% |
| Immigrants | Switzerland | 71.5 /100 | #163 | Good 17.2% |
| Armenians | 70.1 /100 | #164 | Good 17.2% |
| Immigrants | Albania | 64.9 /100 | #165 | Good 17.2% |
| Immigrants | Ecuador | 64.4 /100 | #166 | Good 17.2% |
| Immigrants | Syria | 63.5 /100 | #167 | Good 17.2% |
| Immigrants | Immigrants | 62.5 /100 | #168 | Good 17.2% |
Demographics Similar to Immigrants from Western Africa by Cognitive Disability
In terms of cognitive disability, the demographic groups most similar to Immigrants from Western Africa are Immigrants from Eastern Africa (18.4%, a difference of 0.040%), Seminole (18.3%, a difference of 0.090%), Ugandan (18.3%, a difference of 0.090%), Colville (18.3%, a difference of 0.10%), and Immigrants from Eritrea (18.3%, a difference of 0.21%).
| Demographics | Rating | Rank | Cognitive Disability |
| Immigrants | Ghana | 0.0 /100 | #301 | Tragic 18.3% |
| Barbadians | 0.0 /100 | #302 | Tragic 18.3% |
| Immigrants | Kenya | 0.0 /100 | #303 | Tragic 18.3% |
| Immigrants | Eritrea | 0.0 /100 | #304 | Tragic 18.3% |
| Colville | 0.0 /100 | #305 | Tragic 18.3% |
| Seminole | 0.0 /100 | #306 | Tragic 18.3% |
| Ugandans | 0.0 /100 | #307 | Tragic 18.3% |
| Immigrants | Western Africa | 0.0 /100 | #308 | Tragic 18.4% |
| Immigrants | Eastern Africa | 0.0 /100 | #309 | Tragic 18.4% |
| Choctaw | 0.0 /100 | #310 | Tragic 18.4% |
| Hmong | 0.0 /100 | #311 | Tragic 18.4% |
| Chickasaw | 0.0 /100 | #312 | Tragic 18.5% |
| Yaqui | 0.0 /100 | #313 | Tragic 18.5% |
| Sub-Saharan Africans | 0.0 /100 | #314 | Tragic 18.5% |
| Immigrants | Dominica | 0.0 /100 | #315 | Tragic 18.6% |