Serbian vs Cypriot No Schooling Completed
COMPARE
Serbian
Cypriot
No Schooling Completed
No Schooling Completed Comparison
Serbians
Cypriots
1.7%
NO SCHOOLING COMPLETED
99.7/ 100
METRIC RATING
65th/ 347
METRIC RANK
1.7%
NO SCHOOLING COMPLETED
99.3/ 100
METRIC RATING
80th/ 347
METRIC RANK
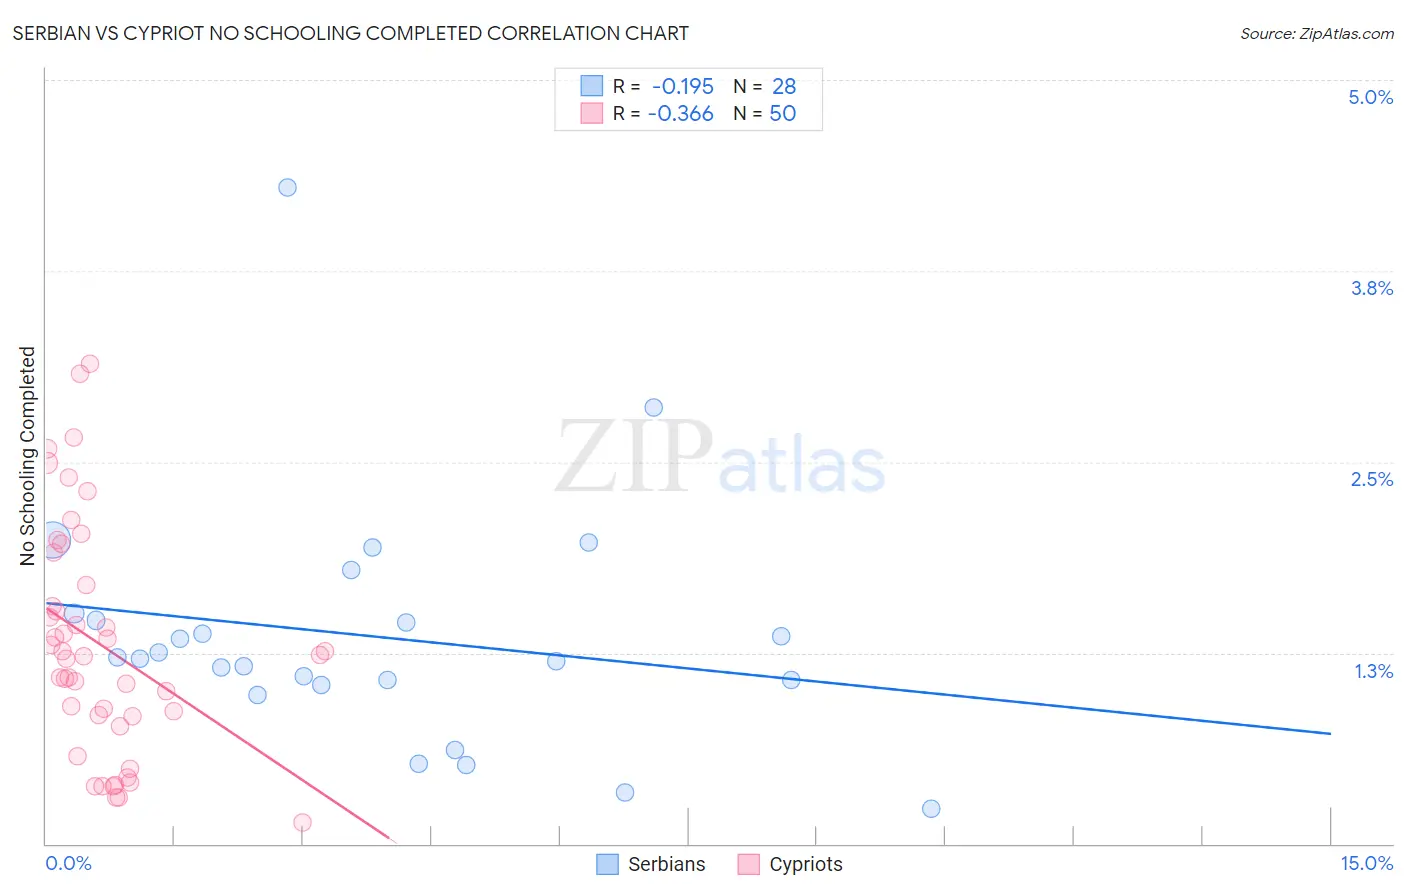
Serbian vs Cypriot No Schooling Completed Correlation Chart
The statistical analysis conducted on geographies consisting of 265,248,882 people shows a poor negative correlation between the proportion of Serbians and percentage of population with no schooling in the United States with a correlation coefficient (R) of -0.195 and weighted average of 1.7%. Similarly, the statistical analysis conducted on geographies consisting of 61,760,973 people shows a mild negative correlation between the proportion of Cypriots and percentage of population with no schooling in the United States with a correlation coefficient (R) of -0.366 and weighted average of 1.7%, a difference of 4.3%.
No Schooling Completed Correlation Summary
| Measurement | Serbian | Cypriot |
| Minimum | 0.23% | 0.14% |
| Maximum | 4.3% | 3.1% |
| Range | 4.1% | 3.0% |
| Mean | 1.4% | 1.3% |
| Median | 1.2% | 1.2% |
| Interquartile 25% (IQ1) | 1.1% | 0.84% |
| Interquartile 75% (IQ3) | 1.5% | 1.7% |
| Interquartile Range (IQR) | 0.43% | 0.85% |
| Standard Deviation (Sample) | 0.80% | 0.75% |
| Standard Deviation (Population) | 0.78% | 0.74% |
Demographics Similar to Serbians and Cypriots by No Schooling Completed
In terms of no schooling completed, the demographic groups most similar to Serbians are New Zealander (1.7%, a difference of 0.040%), Canadian (1.7%, a difference of 0.14%), Russian (1.7%, a difference of 0.20%), Immigrants from Northern Europe (1.7%, a difference of 0.24%), and Immigrants from Austria (1.7%, a difference of 0.33%). Similarly, the demographic groups most similar to Cypriots are Macedonian (1.7%, a difference of 0.010%), Icelander (1.7%, a difference of 0.040%), Delaware (1.7%, a difference of 0.090%), Immigrants from Sweden (1.7%, a difference of 0.13%), and Immigrants from South Africa (1.7%, a difference of 0.13%).
| Demographics | Rating | Rank | No Schooling Completed |
| Immigrants | Northern Europe | 99.8 /100 | #62 | Exceptional 1.7% |
| Russians | 99.8 /100 | #63 | Exceptional 1.7% |
| New Zealanders | 99.7 /100 | #64 | Exceptional 1.7% |
| Serbians | 99.7 /100 | #65 | Exceptional 1.7% |
| Canadians | 99.7 /100 | #66 | Exceptional 1.7% |
| Immigrants | Austria | 99.7 /100 | #67 | Exceptional 1.7% |
| Immigrants | Lithuania | 99.7 /100 | #68 | Exceptional 1.7% |
| Chickasaw | 99.6 /100 | #69 | Exceptional 1.7% |
| Immigrants | Netherlands | 99.6 /100 | #70 | Exceptional 1.7% |
| Immigrants | England | 99.5 /100 | #71 | Exceptional 1.7% |
| Cajuns | 99.5 /100 | #72 | Exceptional 1.7% |
| Immigrants | India | 99.4 /100 | #73 | Exceptional 1.7% |
| Zimbabweans | 99.4 /100 | #74 | Exceptional 1.7% |
| Immigrants | Belgium | 99.3 /100 | #75 | Exceptional 1.7% |
| Cherokee | 99.3 /100 | #76 | Exceptional 1.7% |
| Immigrants | Sweden | 99.3 /100 | #77 | Exceptional 1.7% |
| Delaware | 99.3 /100 | #78 | Exceptional 1.7% |
| Macedonians | 99.3 /100 | #79 | Exceptional 1.7% |
| Cypriots | 99.3 /100 | #80 | Exceptional 1.7% |
| Icelanders | 99.3 /100 | #81 | Exceptional 1.7% |
| Immigrants | South Africa | 99.3 /100 | #82 | Exceptional 1.7% |