Senegalese vs Ottawa Disability Age 65 to 74
COMPARE
Senegalese
Ottawa
Disability Age 65 to 74
Disability Age 65 to 74 Comparison
Senegalese
Ottawa
24.9%
DISABILITY AGE 65 TO 74
0.9/ 100
METRIC RATING
248th/ 347
METRIC RANK
25.6%
DISABILITY AGE 65 TO 74
0.1/ 100
METRIC RATING
267th/ 347
METRIC RANK
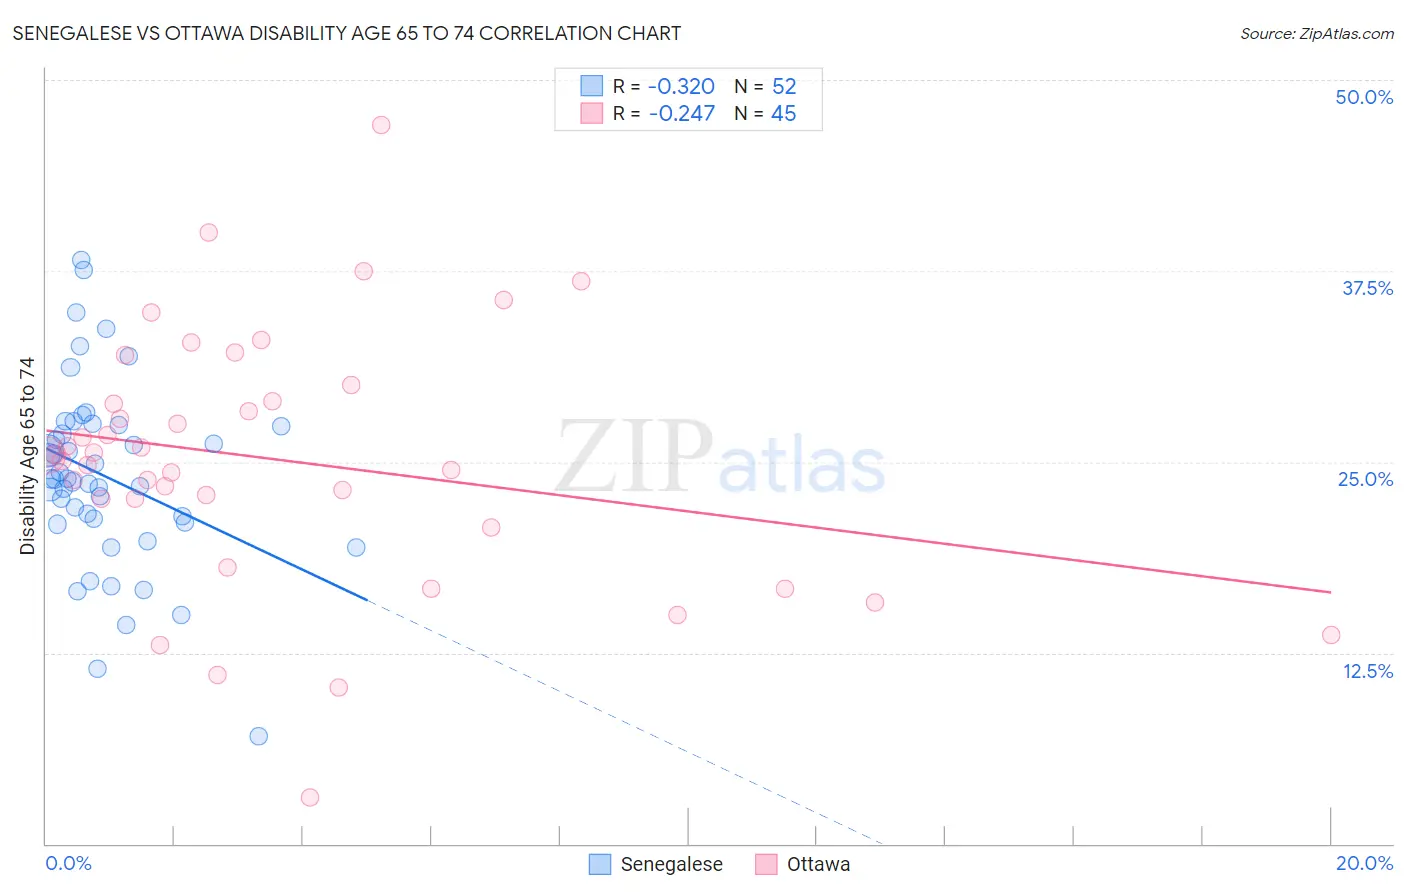
Senegalese vs Ottawa Disability Age 65 to 74 Correlation Chart
The statistical analysis conducted on geographies consisting of 78,090,599 people shows a mild negative correlation between the proportion of Senegalese and percentage of population with a disability between the ages 65 and 75 in the United States with a correlation coefficient (R) of -0.320 and weighted average of 24.9%. Similarly, the statistical analysis conducted on geographies consisting of 49,922,669 people shows a weak negative correlation between the proportion of Ottawa and percentage of population with a disability between the ages 65 and 75 in the United States with a correlation coefficient (R) of -0.247 and weighted average of 25.6%, a difference of 2.7%.
Disability Age 65 to 74 Correlation Summary
| Measurement | Senegalese | Ottawa |
| Minimum | 7.0% | 3.0% |
| Maximum | 38.2% | 47.1% |
| Range | 31.2% | 44.0% |
| Mean | 24.0% | 25.1% |
| Median | 23.9% | 25.5% |
| Interquartile 25% (IQ1) | 21.1% | 21.6% |
| Interquartile 75% (IQ3) | 27.4% | 29.5% |
| Interquartile Range (IQR) | 6.3% | 7.9% |
| Standard Deviation (Sample) | 6.0% | 8.4% |
| Standard Deviation (Population) | 6.0% | 8.3% |
Demographics Similar to Senegalese and Ottawa by Disability Age 65 to 74
In terms of disability age 65 to 74, the demographic groups most similar to Senegalese are Immigrants from Fiji (25.0%, a difference of 0.10%), Salvadoran (25.0%, a difference of 0.12%), Indonesian (24.9%, a difference of 0.25%), Nonimmigrants (25.0%, a difference of 0.32%), and Immigrants from El Salvador (25.1%, a difference of 0.51%). Similarly, the demographic groups most similar to Ottawa are Immigrants from Latin America (25.6%, a difference of 0.14%), Guatemalan (25.5%, a difference of 0.23%), Hawaiian (25.5%, a difference of 0.27%), Samoan (25.4%, a difference of 0.62%), and Iroquois (25.4%, a difference of 0.62%).
| Demographics | Rating | Rank | Disability Age 65 to 74 |
| Indonesians | 1.1 /100 | #247 | Tragic 24.9% |
| Senegalese | 0.9 /100 | #248 | Tragic 24.9% |
| Immigrants | Fiji | 0.8 /100 | #249 | Tragic 25.0% |
| Salvadorans | 0.8 /100 | #250 | Tragic 25.0% |
| Immigrants | Nonimmigrants | 0.7 /100 | #251 | Tragic 25.0% |
| Immigrants | El Salvador | 0.6 /100 | #252 | Tragic 25.1% |
| Sub-Saharan Africans | 0.6 /100 | #253 | Tragic 25.1% |
| Somalis | 0.6 /100 | #254 | Tragic 25.1% |
| Central Americans | 0.5 /100 | #255 | Tragic 25.1% |
| Immigrants | Somalia | 0.4 /100 | #256 | Tragic 25.2% |
| Guamanians/Chamorros | 0.3 /100 | #257 | Tragic 25.3% |
| Marshallese | 0.3 /100 | #258 | Tragic 25.3% |
| Immigrants | Cambodia | 0.3 /100 | #259 | Tragic 25.3% |
| Malaysians | 0.2 /100 | #260 | Tragic 25.4% |
| Cape Verdeans | 0.2 /100 | #261 | Tragic 25.4% |
| Samoans | 0.2 /100 | #262 | Tragic 25.4% |
| Iroquois | 0.2 /100 | #263 | Tragic 25.4% |
| Hawaiians | 0.2 /100 | #264 | Tragic 25.5% |
| Guatemalans | 0.2 /100 | #265 | Tragic 25.5% |
| Immigrants | Latin America | 0.1 /100 | #266 | Tragic 25.6% |
| Ottawa | 0.1 /100 | #267 | Tragic 25.6% |