Senegalese vs Nepalese Disability Age 65 to 74
COMPARE
Senegalese
Nepalese
Disability Age 65 to 74
Disability Age 65 to 74 Comparison
Senegalese
Nepalese
24.9%
DISABILITY AGE 65 TO 74
0.9/ 100
METRIC RATING
248th/ 347
METRIC RANK
28.0%
DISABILITY AGE 65 TO 74
0.0/ 100
METRIC RATING
318th/ 347
METRIC RANK
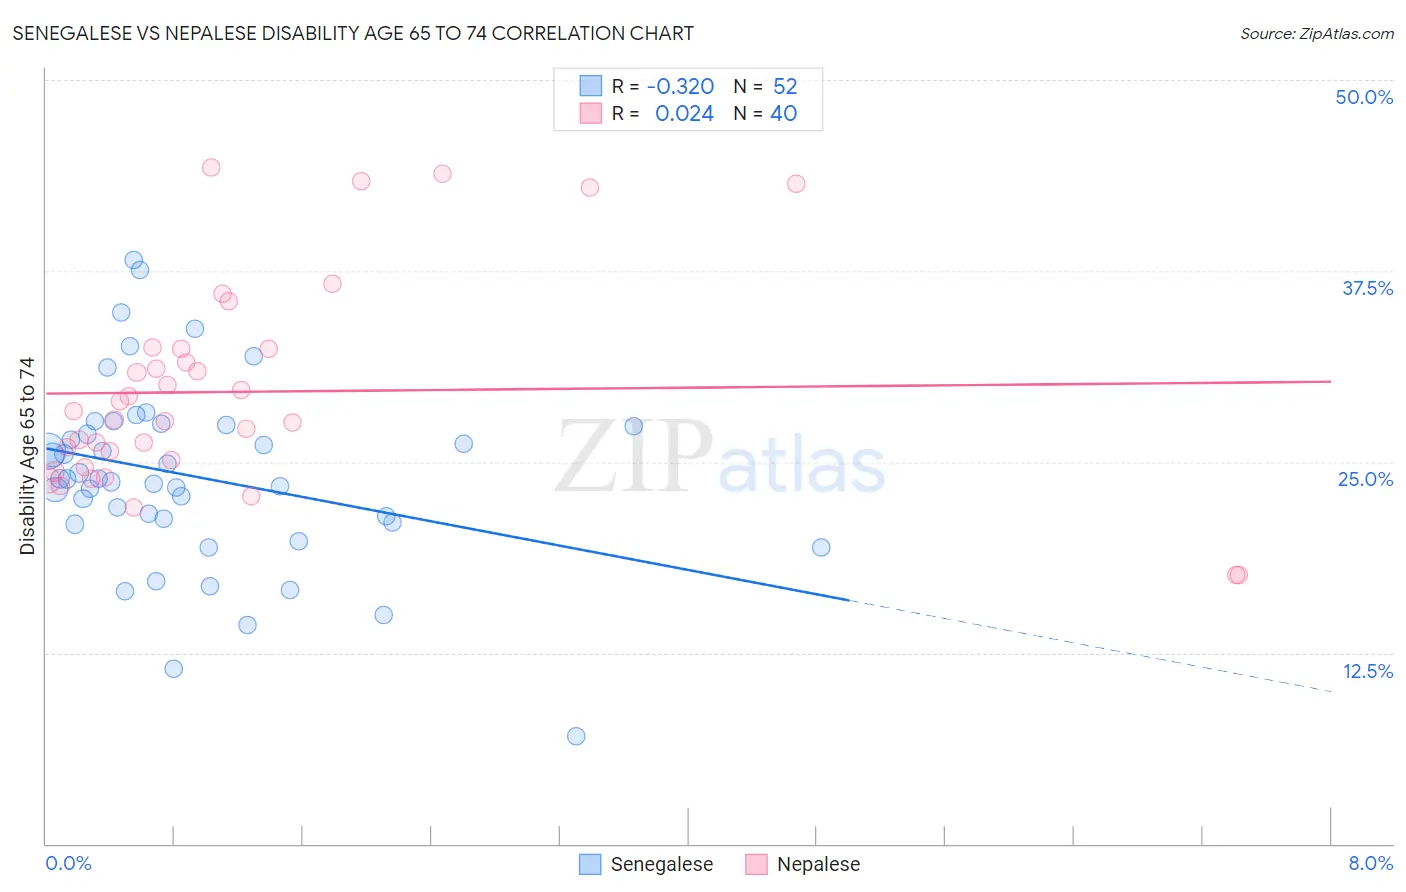
Senegalese vs Nepalese Disability Age 65 to 74 Correlation Chart
The statistical analysis conducted on geographies consisting of 78,090,599 people shows a mild negative correlation between the proportion of Senegalese and percentage of population with a disability between the ages 65 and 75 in the United States with a correlation coefficient (R) of -0.320 and weighted average of 24.9%. Similarly, the statistical analysis conducted on geographies consisting of 24,503,622 people shows no correlation between the proportion of Nepalese and percentage of population with a disability between the ages 65 and 75 in the United States with a correlation coefficient (R) of 0.024 and weighted average of 28.0%, a difference of 12.4%.
Disability Age 65 to 74 Correlation Summary
| Measurement | Senegalese | Nepalese |
| Minimum | 7.0% | 17.6% |
| Maximum | 38.2% | 44.3% |
| Range | 31.2% | 26.7% |
| Mean | 24.0% | 29.6% |
| Median | 23.9% | 28.1% |
| Interquartile 25% (IQ1) | 21.1% | 24.9% |
| Interquartile 75% (IQ3) | 27.4% | 32.4% |
| Interquartile Range (IQR) | 6.3% | 7.5% |
| Standard Deviation (Sample) | 6.0% | 6.8% |
| Standard Deviation (Population) | 6.0% | 6.7% |
Similar Demographics by Disability Age 65 to 74
Demographics Similar to Senegalese by Disability Age 65 to 74
In terms of disability age 65 to 74, the demographic groups most similar to Senegalese are Immigrants from Fiji (25.0%, a difference of 0.10%), Salvadoran (25.0%, a difference of 0.12%), Indonesian (24.9%, a difference of 0.25%), Nonimmigrants (25.0%, a difference of 0.32%), and Immigrants from El Salvador (25.1%, a difference of 0.51%).
| Demographics | Rating | Rank | Disability Age 65 to 74 |
| Immigrants | Western Africa | 2.3 /100 | #241 | Tragic 24.6% |
| Immigrants | Senegal | 2.2 /100 | #242 | Tragic 24.6% |
| Spanish | 2.2 /100 | #243 | Tragic 24.6% |
| Armenians | 2.0 /100 | #244 | Tragic 24.7% |
| British West Indians | 2.0 /100 | #245 | Tragic 24.7% |
| Immigrants | Iraq | 1.9 /100 | #246 | Tragic 24.7% |
| Indonesians | 1.1 /100 | #247 | Tragic 24.9% |
| Senegalese | 0.9 /100 | #248 | Tragic 24.9% |
| Immigrants | Fiji | 0.8 /100 | #249 | Tragic 25.0% |
| Salvadorans | 0.8 /100 | #250 | Tragic 25.0% |
| Immigrants | Nonimmigrants | 0.7 /100 | #251 | Tragic 25.0% |
| Immigrants | El Salvador | 0.6 /100 | #252 | Tragic 25.1% |
| Sub-Saharan Africans | 0.6 /100 | #253 | Tragic 25.1% |
| Somalis | 0.6 /100 | #254 | Tragic 25.1% |
| Central Americans | 0.5 /100 | #255 | Tragic 25.1% |
Demographics Similar to Nepalese by Disability Age 65 to 74
In terms of disability age 65 to 74, the demographic groups most similar to Nepalese are Immigrants from Armenia (28.0%, a difference of 0.22%), Arapaho (28.1%, a difference of 0.23%), Crow (27.9%, a difference of 0.31%), Cajun (27.9%, a difference of 0.35%), and Cherokee (28.2%, a difference of 0.62%).
| Demographics | Rating | Rank | Disability Age 65 to 74 |
| Menominee | 0.0 /100 | #311 | Tragic 27.4% |
| Osage | 0.0 /100 | #312 | Tragic 27.5% |
| Paiute | 0.0 /100 | #313 | Tragic 27.8% |
| Chippewa | 0.0 /100 | #314 | Tragic 27.8% |
| Cajuns | 0.0 /100 | #315 | Tragic 27.9% |
| Crow | 0.0 /100 | #316 | Tragic 27.9% |
| Immigrants | Armenia | 0.0 /100 | #317 | Tragic 28.0% |
| Nepalese | 0.0 /100 | #318 | Tragic 28.0% |
| Arapaho | 0.0 /100 | #319 | Tragic 28.1% |
| Cherokee | 0.0 /100 | #320 | Tragic 28.2% |
| Comanche | 0.0 /100 | #321 | Tragic 28.3% |
| Aleuts | 0.0 /100 | #322 | Tragic 28.4% |
| Puerto Ricans | 0.0 /100 | #323 | Tragic 29.1% |
| Seminole | 0.0 /100 | #324 | Tragic 29.4% |
| Dutch West Indians | 0.0 /100 | #325 | Tragic 29.6% |