Senegalese vs Immigrants from England Disability Age 65 to 74
COMPARE
Senegalese
Immigrants from England
Disability Age 65 to 74
Disability Age 65 to 74 Comparison
Senegalese
Immigrants from England
24.9%
DISABILITY AGE 65 TO 74
0.9/ 100
METRIC RATING
248th/ 347
METRIC RANK
22.2%
DISABILITY AGE 65 TO 74
96.5/ 100
METRIC RATING
101st/ 347
METRIC RANK
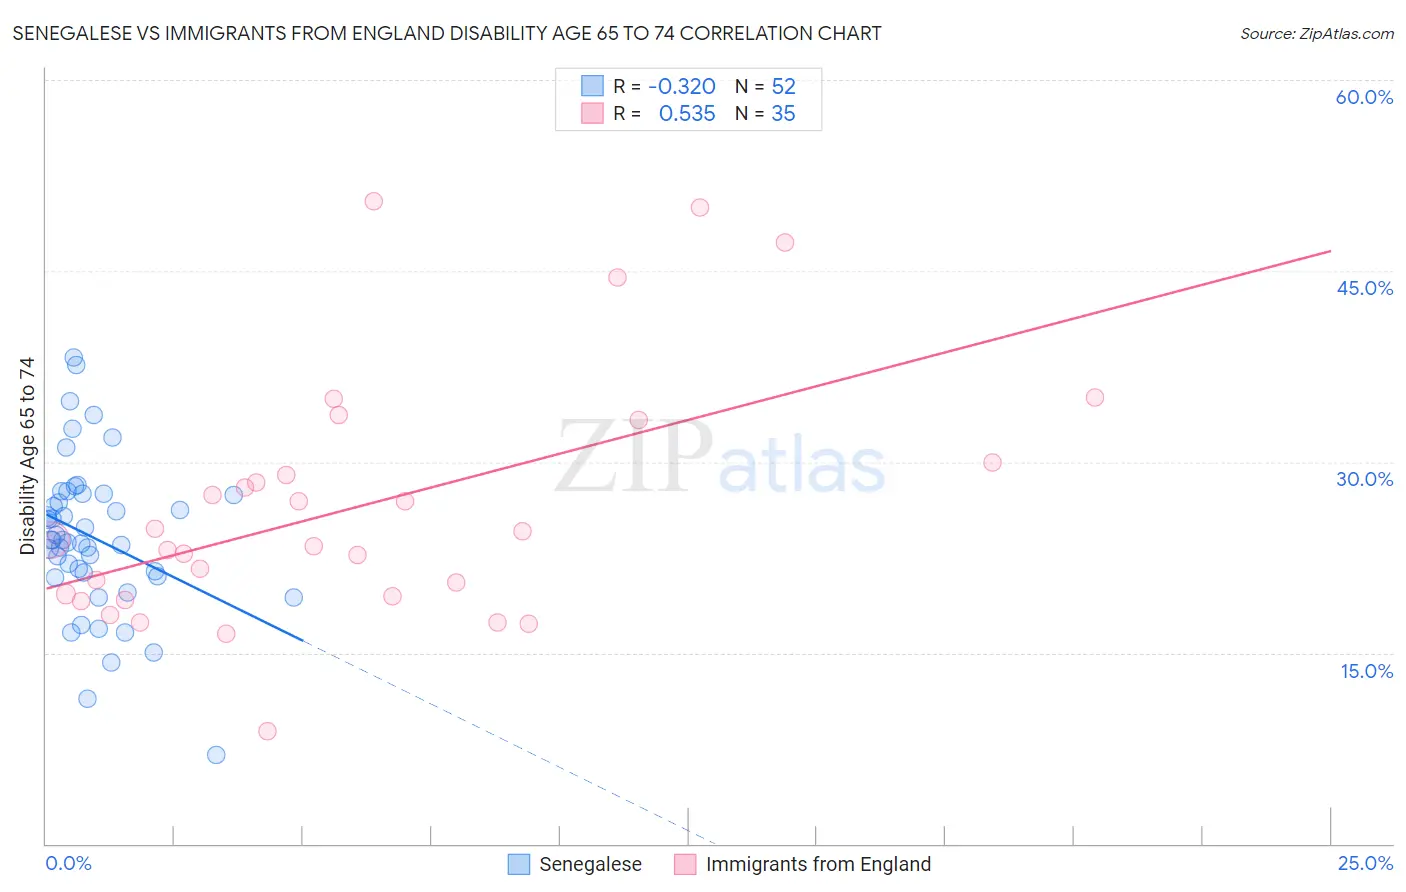
Senegalese vs Immigrants from England Disability Age 65 to 74 Correlation Chart
The statistical analysis conducted on geographies consisting of 78,090,599 people shows a mild negative correlation between the proportion of Senegalese and percentage of population with a disability between the ages 65 and 75 in the United States with a correlation coefficient (R) of -0.320 and weighted average of 24.9%. Similarly, the statistical analysis conducted on geographies consisting of 391,407,764 people shows a substantial positive correlation between the proportion of Immigrants from England and percentage of population with a disability between the ages 65 and 75 in the United States with a correlation coefficient (R) of 0.535 and weighted average of 22.2%, a difference of 12.3%.
Disability Age 65 to 74 Correlation Summary
| Measurement | Senegalese | Immigrants from England |
| Minimum | 7.0% | 8.8% |
| Maximum | 38.2% | 50.5% |
| Range | 31.2% | 41.7% |
| Mean | 24.0% | 26.5% |
| Median | 23.9% | 23.9% |
| Interquartile 25% (IQ1) | 21.1% | 19.4% |
| Interquartile 75% (IQ3) | 27.4% | 30.0% |
| Interquartile Range (IQR) | 6.3% | 10.6% |
| Standard Deviation (Sample) | 6.0% | 9.8% |
| Standard Deviation (Population) | 6.0% | 9.6% |
Similar Demographics by Disability Age 65 to 74
Demographics Similar to Senegalese by Disability Age 65 to 74
In terms of disability age 65 to 74, the demographic groups most similar to Senegalese are Immigrants from Fiji (25.0%, a difference of 0.10%), Salvadoran (25.0%, a difference of 0.12%), Indonesian (24.9%, a difference of 0.25%), Nonimmigrants (25.0%, a difference of 0.32%), and Immigrants from El Salvador (25.1%, a difference of 0.51%).
| Demographics | Rating | Rank | Disability Age 65 to 74 |
| Immigrants | Western Africa | 2.3 /100 | #241 | Tragic 24.6% |
| Immigrants | Senegal | 2.2 /100 | #242 | Tragic 24.6% |
| Spanish | 2.2 /100 | #243 | Tragic 24.6% |
| Armenians | 2.0 /100 | #244 | Tragic 24.7% |
| British West Indians | 2.0 /100 | #245 | Tragic 24.7% |
| Immigrants | Iraq | 1.9 /100 | #246 | Tragic 24.7% |
| Indonesians | 1.1 /100 | #247 | Tragic 24.9% |
| Senegalese | 0.9 /100 | #248 | Tragic 24.9% |
| Immigrants | Fiji | 0.8 /100 | #249 | Tragic 25.0% |
| Salvadorans | 0.8 /100 | #250 | Tragic 25.0% |
| Immigrants | Nonimmigrants | 0.7 /100 | #251 | Tragic 25.0% |
| Immigrants | El Salvador | 0.6 /100 | #252 | Tragic 25.1% |
| Sub-Saharan Africans | 0.6 /100 | #253 | Tragic 25.1% |
| Somalis | 0.6 /100 | #254 | Tragic 25.1% |
| Central Americans | 0.5 /100 | #255 | Tragic 25.1% |
Demographics Similar to Immigrants from England by Disability Age 65 to 74
In terms of disability age 65 to 74, the demographic groups most similar to Immigrants from England are Uruguayan (22.2%, a difference of 0.020%), Immigrants from Saudi Arabia (22.2%, a difference of 0.020%), South American (22.2%, a difference of 0.050%), Colombian (22.2%, a difference of 0.060%), and Palestinian (22.2%, a difference of 0.10%).
| Demographics | Rating | Rank | Disability Age 65 to 74 |
| Immigrants | Chile | 97.7 /100 | #94 | Exceptional 22.1% |
| Romanians | 97.7 /100 | #95 | Exceptional 22.1% |
| Immigrants | North America | 97.5 /100 | #96 | Exceptional 22.1% |
| Immigrants | Southern Europe | 97.2 /100 | #97 | Exceptional 22.1% |
| Jordanians | 96.9 /100 | #98 | Exceptional 22.2% |
| Immigrants | Colombia | 96.8 /100 | #99 | Exceptional 22.2% |
| Uruguayans | 96.5 /100 | #100 | Exceptional 22.2% |
| Immigrants | England | 96.5 /100 | #101 | Exceptional 22.2% |
| Immigrants | Saudi Arabia | 96.4 /100 | #102 | Exceptional 22.2% |
| South Americans | 96.4 /100 | #103 | Exceptional 22.2% |
| Colombians | 96.4 /100 | #104 | Exceptional 22.2% |
| Palestinians | 96.3 /100 | #105 | Exceptional 22.2% |
| Peruvians | 96.1 /100 | #106 | Exceptional 22.2% |
| Slovenes | 96.1 /100 | #107 | Exceptional 22.2% |
| Immigrants | Zimbabwe | 96.1 /100 | #108 | Exceptional 22.3% |