Immigrants from the Azores vs Nepalese Disability Age 65 to 74
COMPARE
Immigrants from the Azores
Nepalese
Disability Age 65 to 74
Disability Age 65 to 74 Comparison
Immigrants from the Azores
Nepalese
26.0%
DISABILITY AGE 65 TO 74
0.0/ 100
METRIC RATING
284th/ 347
METRIC RANK
28.0%
DISABILITY AGE 65 TO 74
0.0/ 100
METRIC RATING
318th/ 347
METRIC RANK
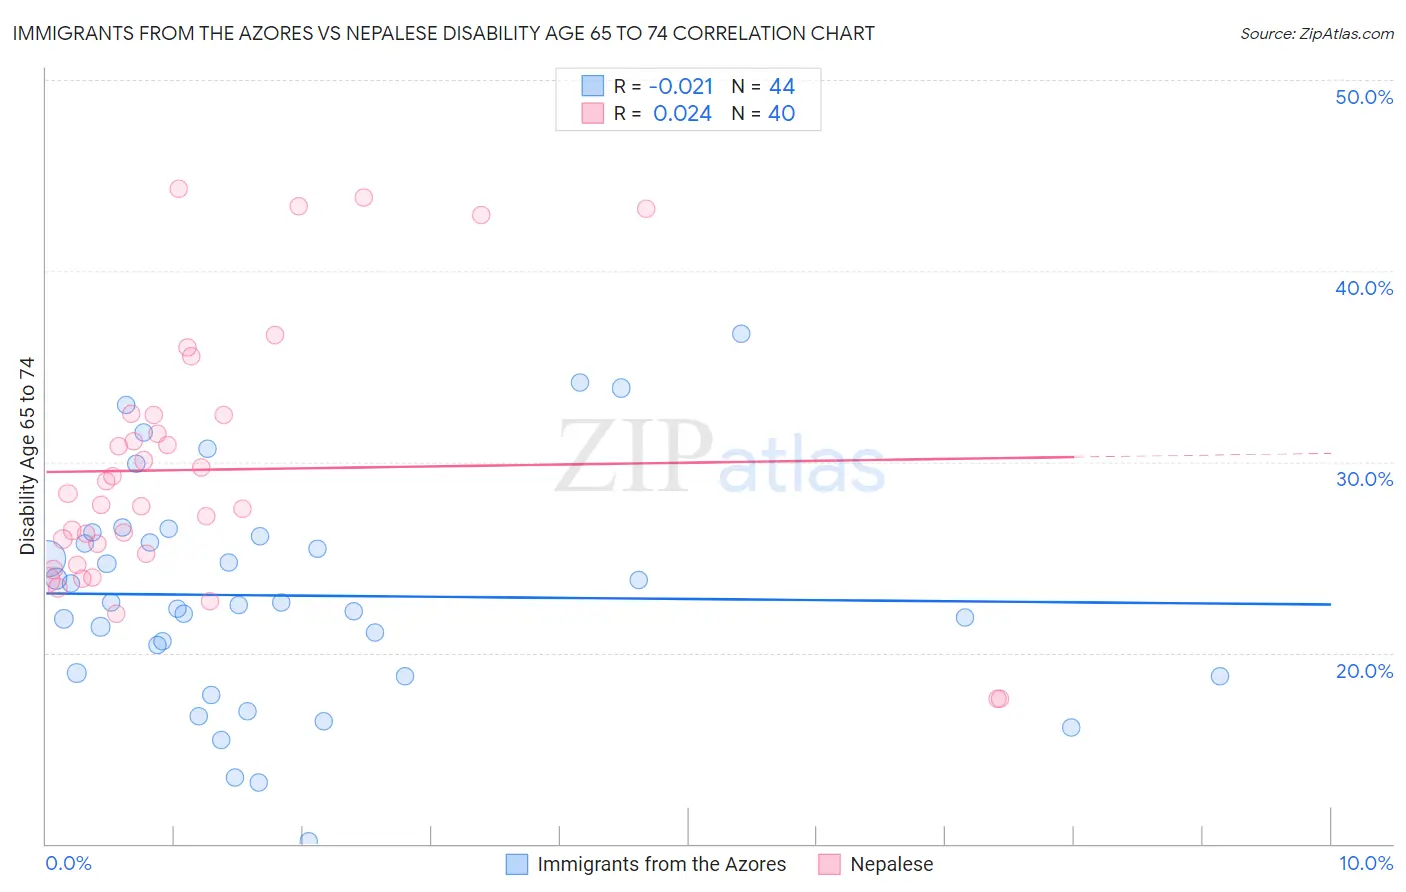
Immigrants from the Azores vs Nepalese Disability Age 65 to 74 Correlation Chart
The statistical analysis conducted on geographies consisting of 46,238,096 people shows no correlation between the proportion of Immigrants from the Azores and percentage of population with a disability between the ages 65 and 75 in the United States with a correlation coefficient (R) of -0.021 and weighted average of 26.0%. Similarly, the statistical analysis conducted on geographies consisting of 24,503,622 people shows no correlation between the proportion of Nepalese and percentage of population with a disability between the ages 65 and 75 in the United States with a correlation coefficient (R) of 0.024 and weighted average of 28.0%, a difference of 7.8%.
Disability Age 65 to 74 Correlation Summary
| Measurement | Immigrants from the Azores | Nepalese |
| Minimum | 10.1% | 17.6% |
| Maximum | 36.7% | 44.3% |
| Range | 26.6% | 26.7% |
| Mean | 23.0% | 29.6% |
| Median | 22.6% | 28.1% |
| Interquartile 25% (IQ1) | 18.9% | 24.9% |
| Interquartile 75% (IQ3) | 25.9% | 32.4% |
| Interquartile Range (IQR) | 7.1% | 7.5% |
| Standard Deviation (Sample) | 5.8% | 6.8% |
| Standard Deviation (Population) | 5.8% | 6.7% |
Similar Demographics by Disability Age 65 to 74
Demographics Similar to Immigrants from the Azores by Disability Age 65 to 74
In terms of disability age 65 to 74, the demographic groups most similar to Immigrants from the Azores are Immigrants from Congo (26.0%, a difference of 0.020%), Spanish American (25.9%, a difference of 0.19%), Delaware (25.9%, a difference of 0.33%), Immigrants from Honduras (25.9%, a difference of 0.40%), and Cree (25.9%, a difference of 0.42%).
| Demographics | Rating | Rank | Disability Age 65 to 74 |
| Belizeans | 0.1 /100 | #277 | Tragic 25.8% |
| Immigrants | Belize | 0.1 /100 | #278 | Tragic 25.8% |
| U.S. Virgin Islanders | 0.1 /100 | #279 | Tragic 25.9% |
| Cree | 0.1 /100 | #280 | Tragic 25.9% |
| Immigrants | Honduras | 0.1 /100 | #281 | Tragic 25.9% |
| Delaware | 0.1 /100 | #282 | Tragic 25.9% |
| Spanish Americans | 0.0 /100 | #283 | Tragic 25.9% |
| Immigrants | Azores | 0.0 /100 | #284 | Tragic 26.0% |
| Immigrants | Congo | 0.0 /100 | #285 | Tragic 26.0% |
| Immigrants | Micronesia | 0.0 /100 | #286 | Tragic 26.1% |
| Immigrants | Laos | 0.0 /100 | #287 | Tragic 26.1% |
| Mexican American Indians | 0.0 /100 | #288 | Tragic 26.2% |
| Africans | 0.0 /100 | #289 | Tragic 26.2% |
| Immigrants | Cabo Verde | 0.0 /100 | #290 | Tragic 26.3% |
| Spanish American Indians | 0.0 /100 | #291 | Tragic 26.4% |
Demographics Similar to Nepalese by Disability Age 65 to 74
In terms of disability age 65 to 74, the demographic groups most similar to Nepalese are Immigrants from Armenia (28.0%, a difference of 0.22%), Arapaho (28.1%, a difference of 0.23%), Crow (27.9%, a difference of 0.31%), Cajun (27.9%, a difference of 0.35%), and Cherokee (28.2%, a difference of 0.62%).
| Demographics | Rating | Rank | Disability Age 65 to 74 |
| Menominee | 0.0 /100 | #311 | Tragic 27.4% |
| Osage | 0.0 /100 | #312 | Tragic 27.5% |
| Paiute | 0.0 /100 | #313 | Tragic 27.8% |
| Chippewa | 0.0 /100 | #314 | Tragic 27.8% |
| Cajuns | 0.0 /100 | #315 | Tragic 27.9% |
| Crow | 0.0 /100 | #316 | Tragic 27.9% |
| Immigrants | Armenia | 0.0 /100 | #317 | Tragic 28.0% |
| Nepalese | 0.0 /100 | #318 | Tragic 28.0% |
| Arapaho | 0.0 /100 | #319 | Tragic 28.1% |
| Cherokee | 0.0 /100 | #320 | Tragic 28.2% |
| Comanche | 0.0 /100 | #321 | Tragic 28.3% |
| Aleuts | 0.0 /100 | #322 | Tragic 28.4% |
| Puerto Ricans | 0.0 /100 | #323 | Tragic 29.1% |
| Seminole | 0.0 /100 | #324 | Tragic 29.4% |
| Dutch West Indians | 0.0 /100 | #325 | Tragic 29.6% |