Senegalese vs Nepalese Disability Age 35 to 64
COMPARE
Senegalese
Nepalese
Disability Age 35 to 64
Disability Age 35 to 64 Comparison
Senegalese
Nepalese
12.5%
DISABILITY AGE 35 TO 64
0.5/ 100
METRIC RATING
262nd/ 347
METRIC RANK
12.8%
DISABILITY AGE 35 TO 64
0.1/ 100
METRIC RATING
271st/ 347
METRIC RANK
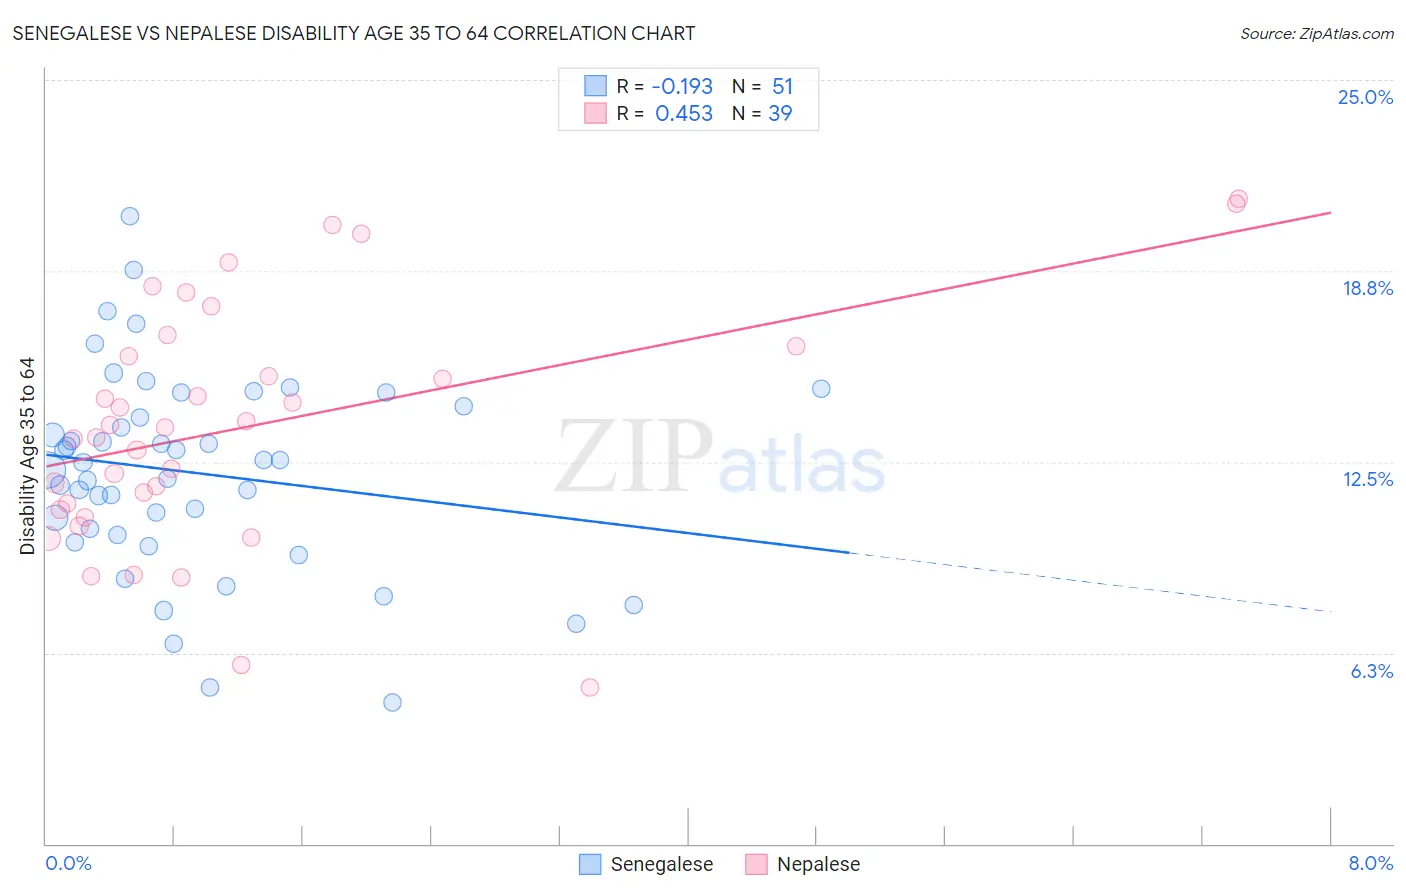
Senegalese vs Nepalese Disability Age 35 to 64 Correlation Chart
The statistical analysis conducted on geographies consisting of 78,098,003 people shows a poor negative correlation between the proportion of Senegalese and percentage of population with a disability between the ages 34 and 64 in the United States with a correlation coefficient (R) of -0.193 and weighted average of 12.5%. Similarly, the statistical analysis conducted on geographies consisting of 24,500,920 people shows a moderate positive correlation between the proportion of Nepalese and percentage of population with a disability between the ages 34 and 64 in the United States with a correlation coefficient (R) of 0.453 and weighted average of 12.8%, a difference of 2.7%.
Disability Age 35 to 64 Correlation Summary
| Measurement | Senegalese | Nepalese |
| Minimum | 4.6% | 5.1% |
| Maximum | 20.5% | 21.1% |
| Range | 15.9% | 16.0% |
| Mean | 12.1% | 13.7% |
| Median | 12.5% | 13.6% |
| Interquartile 25% (IQ1) | 10.1% | 10.9% |
| Interquartile 75% (IQ3) | 14.3% | 16.3% |
| Interquartile Range (IQR) | 4.2% | 5.3% |
| Standard Deviation (Sample) | 3.3% | 3.9% |
| Standard Deviation (Population) | 3.2% | 3.9% |
Demographics Similar to Senegalese and Nepalese by Disability Age 35 to 64
In terms of disability age 35 to 64, the demographic groups most similar to Senegalese are Malaysian (12.5%, a difference of 0.080%), German Russian (12.5%, a difference of 0.23%), Immigrants from Zaire (12.5%, a difference of 0.25%), Immigrants from Portugal (12.5%, a difference of 0.26%), and Marshallese (12.5%, a difference of 0.37%). Similarly, the demographic groups most similar to Nepalese are U.S. Virgin Islander (12.8%, a difference of 0.12%), Pennsylvania German (12.8%, a difference of 0.21%), Celtic (12.9%, a difference of 0.23%), Dominican (12.9%, a difference of 0.37%), and Somali (12.9%, a difference of 0.49%).
| Demographics | Rating | Rank | Disability Age 35 to 64 |
| Scottish | 0.8 /100 | #256 | Tragic 12.4% |
| Mexicans | 0.7 /100 | #257 | Tragic 12.4% |
| Welsh | 0.6 /100 | #258 | Tragic 12.4% |
| English | 0.6 /100 | #259 | Tragic 12.4% |
| German Russians | 0.5 /100 | #260 | Tragic 12.5% |
| Malaysians | 0.5 /100 | #261 | Tragic 12.5% |
| Senegalese | 0.5 /100 | #262 | Tragic 12.5% |
| Immigrants | Zaire | 0.4 /100 | #263 | Tragic 12.5% |
| Immigrants | Portugal | 0.4 /100 | #264 | Tragic 12.5% |
| Marshallese | 0.4 /100 | #265 | Tragic 12.5% |
| Whites/Caucasians | 0.3 /100 | #266 | Tragic 12.6% |
| Sub-Saharan Africans | 0.2 /100 | #267 | Tragic 12.6% |
| Immigrants | Dominica | 0.2 /100 | #268 | Tragic 12.7% |
| Spanish | 0.2 /100 | #269 | Tragic 12.7% |
| French | 0.2 /100 | #270 | Tragic 12.7% |
| Nepalese | 0.1 /100 | #271 | Tragic 12.8% |
| U.S. Virgin Islanders | 0.1 /100 | #272 | Tragic 12.8% |
| Pennsylvania Germans | 0.1 /100 | #273 | Tragic 12.8% |
| Celtics | 0.1 /100 | #274 | Tragic 12.9% |
| Dominicans | 0.1 /100 | #275 | Tragic 12.9% |
| Somalis | 0.1 /100 | #276 | Tragic 12.9% |