Senegalese vs Immigrants from Ethiopia Ambulatory Disability
COMPARE
Senegalese
Immigrants from Ethiopia
Ambulatory Disability
Ambulatory Disability Comparison
Senegalese
Immigrants from Ethiopia
6.4%
AMBULATORY DISABILITY
1.7/ 100
METRIC RATING
239th/ 347
METRIC RANK
5.4%
AMBULATORY DISABILITY
100.0/ 100
METRIC RATING
17th/ 347
METRIC RANK
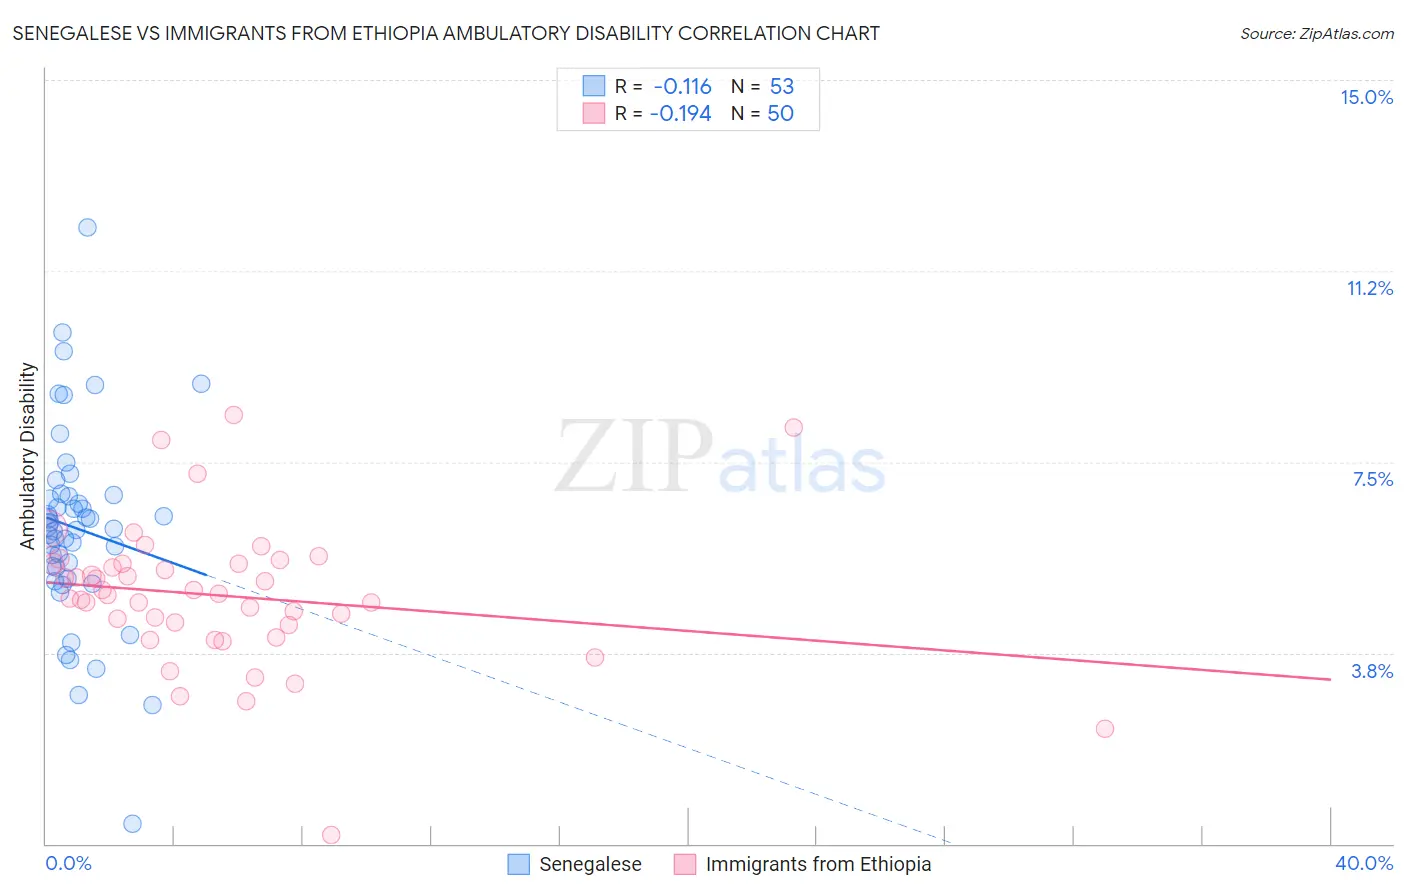
Senegalese vs Immigrants from Ethiopia Ambulatory Disability Correlation Chart
The statistical analysis conducted on geographies consisting of 78,138,068 people shows a poor negative correlation between the proportion of Senegalese and percentage of population with ambulatory disability in the United States with a correlation coefficient (R) of -0.116 and weighted average of 6.4%. Similarly, the statistical analysis conducted on geographies consisting of 211,510,765 people shows a poor negative correlation between the proportion of Immigrants from Ethiopia and percentage of population with ambulatory disability in the United States with a correlation coefficient (R) of -0.194 and weighted average of 5.4%, a difference of 20.3%.
Ambulatory Disability Correlation Summary
| Measurement | Senegalese | Immigrants from Ethiopia |
| Minimum | 0.40% | 0.17% |
| Maximum | 12.1% | 8.4% |
| Range | 11.7% | 8.2% |
| Mean | 6.2% | 4.9% |
| Median | 6.2% | 4.9% |
| Interquartile 25% (IQ1) | 5.3% | 4.3% |
| Interquartile 75% (IQ3) | 6.8% | 5.5% |
| Interquartile Range (IQR) | 1.5% | 1.2% |
| Standard Deviation (Sample) | 1.9% | 1.4% |
| Standard Deviation (Population) | 1.9% | 1.4% |
Similar Demographics by Ambulatory Disability
Demographics Similar to Senegalese by Ambulatory Disability
In terms of ambulatory disability, the demographic groups most similar to Senegalese are Immigrants from Senegal (6.4%, a difference of 0.030%), Haitian (6.4%, a difference of 0.070%), Immigrants from Germany (6.4%, a difference of 0.080%), Immigrants from Haiti (6.5%, a difference of 0.11%), and Spaniard (6.5%, a difference of 0.14%).
| Demographics | Rating | Rank | Ambulatory Disability |
| Assyrians/Chaldeans/Syriacs | 2.4 /100 | #232 | Tragic 6.4% |
| Sub-Saharan Africans | 2.3 /100 | #233 | Tragic 6.4% |
| Immigrants | Liberia | 2.3 /100 | #234 | Tragic 6.4% |
| Hispanics or Latinos | 2.2 /100 | #235 | Tragic 6.4% |
| Dutch | 2.0 /100 | #236 | Tragic 6.4% |
| Immigrants | Germany | 1.8 /100 | #237 | Tragic 6.4% |
| Haitians | 1.8 /100 | #238 | Tragic 6.4% |
| Senegalese | 1.7 /100 | #239 | Tragic 6.4% |
| Immigrants | Senegal | 1.7 /100 | #240 | Tragic 6.4% |
| Immigrants | Haiti | 1.6 /100 | #241 | Tragic 6.5% |
| Spaniards | 1.6 /100 | #242 | Tragic 6.5% |
| Germans | 1.5 /100 | #243 | Tragic 6.5% |
| Immigrants | Panama | 1.5 /100 | #244 | Tragic 6.5% |
| Tlingit-Haida | 1.5 /100 | #245 | Tragic 6.5% |
| Armenians | 1.5 /100 | #246 | Tragic 6.5% |
Demographics Similar to Immigrants from Ethiopia by Ambulatory Disability
In terms of ambulatory disability, the demographic groups most similar to Immigrants from Ethiopia are Immigrants from Sri Lanka (5.4%, a difference of 0.010%), Indian (Asian) (5.4%, a difference of 0.11%), Ethiopian (5.4%, a difference of 0.13%), Immigrants from Kuwait (5.4%, a difference of 0.13%), and Immigrants from Hong Kong (5.3%, a difference of 0.34%).
| Demographics | Rating | Rank | Ambulatory Disability |
| Yup'ik | 100.0 /100 | #10 | Exceptional 5.2% |
| Immigrants | Korea | 100.0 /100 | #11 | Exceptional 5.2% |
| Okinawans | 100.0 /100 | #12 | Exceptional 5.3% |
| Burmese | 100.0 /100 | #13 | Exceptional 5.3% |
| Immigrants | Eastern Asia | 100.0 /100 | #14 | Exceptional 5.3% |
| Immigrants | China | 100.0 /100 | #15 | Exceptional 5.3% |
| Immigrants | Hong Kong | 100.0 /100 | #16 | Exceptional 5.3% |
| Immigrants | Ethiopia | 100.0 /100 | #17 | Exceptional 5.4% |
| Immigrants | Sri Lanka | 100.0 /100 | #18 | Exceptional 5.4% |
| Indians (Asian) | 100.0 /100 | #19 | Exceptional 5.4% |
| Ethiopians | 100.0 /100 | #20 | Exceptional 5.4% |
| Immigrants | Kuwait | 100.0 /100 | #21 | Exceptional 5.4% |
| Immigrants | Israel | 100.0 /100 | #22 | Exceptional 5.4% |
| Tongans | 100.0 /100 | #23 | Exceptional 5.4% |
| Immigrants | Saudi Arabia | 100.0 /100 | #24 | Exceptional 5.4% |