Cherokee vs Egyptian Cognitive Disability
COMPARE
Cherokee
Egyptian
Cognitive Disability
Cognitive Disability Comparison
Cherokee
Egyptians
18.0%
COGNITIVE DISABILITY
0.3/ 100
METRIC RATING
268th/ 347
METRIC RANK
16.7%
COGNITIVE DISABILITY
99.2/ 100
METRIC RATING
80th/ 347
METRIC RANK
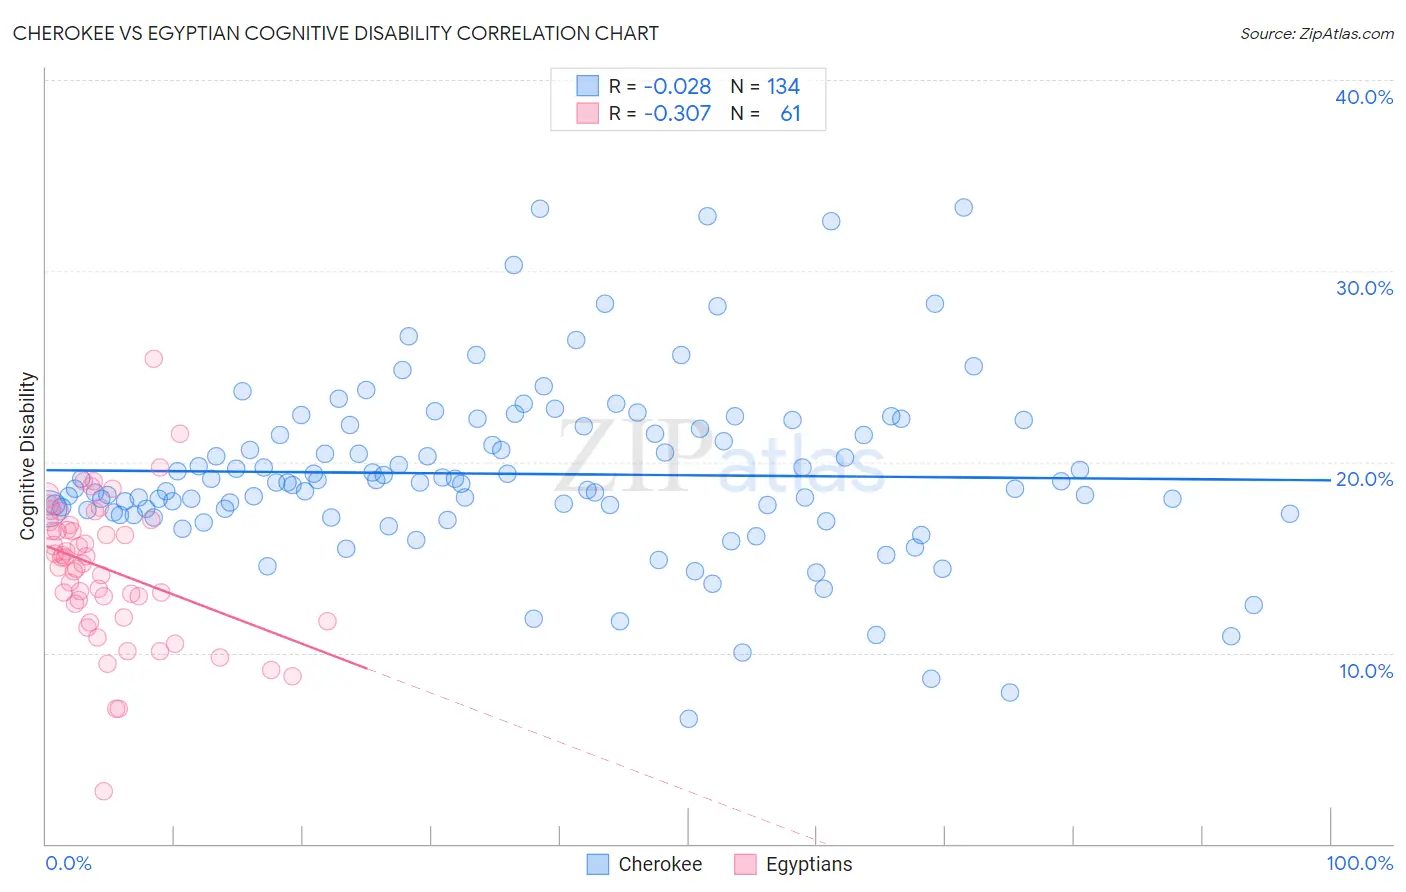
Cherokee vs Egyptian Cognitive Disability Correlation Chart
The statistical analysis conducted on geographies consisting of 493,579,775 people shows no correlation between the proportion of Cherokee and percentage of population with cognitive disability in the United States with a correlation coefficient (R) of -0.028 and weighted average of 18.0%. Similarly, the statistical analysis conducted on geographies consisting of 276,907,223 people shows a mild negative correlation between the proportion of Egyptians and percentage of population with cognitive disability in the United States with a correlation coefficient (R) of -0.307 and weighted average of 16.7%, a difference of 7.8%.
Cognitive Disability Correlation Summary
| Measurement | Cherokee | Egyptian |
| Minimum | 6.5% | 2.7% |
| Maximum | 33.3% | 25.4% |
| Range | 26.8% | 22.7% |
| Mean | 19.4% | 14.4% |
| Median | 18.9% | 15.0% |
| Interquartile 25% (IQ1) | 17.4% | 12.2% |
| Interquartile 75% (IQ3) | 21.8% | 16.8% |
| Interquartile Range (IQR) | 4.4% | 4.6% |
| Standard Deviation (Sample) | 4.6% | 3.8% |
| Standard Deviation (Population) | 4.6% | 3.7% |
Similar Demographics by Cognitive Disability
Demographics Similar to Cherokee by Cognitive Disability
In terms of cognitive disability, the demographic groups most similar to Cherokee are Nepalese (18.0%, a difference of 0.010%), Spanish American (18.0%, a difference of 0.070%), Belizean (18.0%, a difference of 0.070%), Menominee (18.0%, a difference of 0.10%), and Honduran (18.0%, a difference of 0.14%).
| Demographics | Rating | Rank | Cognitive Disability |
| Guamanians/Chamorros | 0.5 /100 | #261 | Tragic 17.9% |
| Sierra Leoneans | 0.4 /100 | #262 | Tragic 17.9% |
| Immigrants | Barbados | 0.4 /100 | #263 | Tragic 17.9% |
| Menominee | 0.4 /100 | #264 | Tragic 18.0% |
| Spanish Americans | 0.4 /100 | #265 | Tragic 18.0% |
| Belizeans | 0.4 /100 | #266 | Tragic 18.0% |
| Nepalese | 0.3 /100 | #267 | Tragic 18.0% |
| Cherokee | 0.3 /100 | #268 | Tragic 18.0% |
| Hondurans | 0.3 /100 | #269 | Tragic 18.0% |
| Immigrants | Bahamas | 0.3 /100 | #270 | Tragic 18.0% |
| Potawatomi | 0.2 /100 | #271 | Tragic 18.0% |
| Immigrants | Honduras | 0.2 /100 | #272 | Tragic 18.0% |
| Immigrants | Nepal | 0.2 /100 | #273 | Tragic 18.0% |
| Immigrants | Nigeria | 0.2 /100 | #274 | Tragic 18.0% |
| Immigrants | Laos | 0.2 /100 | #275 | Tragic 18.1% |
Demographics Similar to Egyptians by Cognitive Disability
In terms of cognitive disability, the demographic groups most similar to Egyptians are Immigrants from Netherlands (16.7%, a difference of 0.010%), Peruvian (16.7%, a difference of 0.030%), Immigrants from Bulgaria (16.7%, a difference of 0.030%), Immigrants from Serbia (16.7%, a difference of 0.040%), and Immigrants from Hungary (16.7%, a difference of 0.040%).
| Demographics | Rating | Rank | Cognitive Disability |
| Burmese | 99.3 /100 | #73 | Exceptional 16.7% |
| Slavs | 99.3 /100 | #74 | Exceptional 16.7% |
| Estonians | 99.3 /100 | #75 | Exceptional 16.7% |
| Immigrants | Serbia | 99.3 /100 | #76 | Exceptional 16.7% |
| Immigrants | Hungary | 99.3 /100 | #77 | Exceptional 16.7% |
| Peruvians | 99.3 /100 | #78 | Exceptional 16.7% |
| Immigrants | Bulgaria | 99.3 /100 | #79 | Exceptional 16.7% |
| Egyptians | 99.2 /100 | #80 | Exceptional 16.7% |
| Immigrants | Netherlands | 99.2 /100 | #81 | Exceptional 16.7% |
| Swiss | 99.2 /100 | #82 | Exceptional 16.7% |
| Serbians | 99.1 /100 | #83 | Exceptional 16.7% |
| Belgians | 99.1 /100 | #84 | Exceptional 16.7% |
| Immigrants | Moldova | 99.1 /100 | #85 | Exceptional 16.7% |
| Immigrants | South Africa | 99.0 /100 | #86 | Exceptional 16.7% |
| Native Hawaiians | 99.0 /100 | #87 | Exceptional 16.7% |